Statistical plot of cells
Usage
CellStatPlot(
  srt,
  stat.by,
  group.by = NULL,
  split.by = NULL,
  bg.by = NULL,
  cells = NULL,
  flip = FALSE,
  NA_color = "grey",
  NA_stat = TRUE,
  keep_empty = FALSE,
  individual = FALSE,
  stat_level = NULL,
  plot_type = c("bar", "rose", "ring", "pie", "trend", "area", "dot", "sankey", "chord",
    "venn", "upset"),
  stat_type = c("percent", "count"),
  position = c("stack", "dodge"),
  palette = "Paired",
  palcolor = NULL,
  alpha = 1,
  bg_palette = "Paired",
  bg_palcolor = NULL,
  bg_alpha = 0.2,
  label = FALSE,
  label.size = 3.5,
  label.fg = "black",
  label.bg = "white",
  label.bg.r = 0.1,
  aspect.ratio = NULL,
  title = NULL,
  subtitle = NULL,
  xlab = NULL,
  ylab = NULL,
  legend.position = "right",
  legend.direction = "vertical",
  theme_use = "theme_scp",
  theme_args = list(),
  combine = TRUE,
  nrow = NULL,
  ncol = NULL,
  byrow = TRUE,
  force = FALSE,
  seed = 11
)
Arguments
- srt
A Seurat object.
- stat.by
The column name(s) in
meta.dataspecifying the variable(s) to be plotted.- group.by
The column name in
meta.dataspecifying the grouping variable.- split.by
The column name in
meta.dataspecifying the splitting variable.- bg.by
The column name in
meta.dataspecifying the background variable for bar plots.- cells
A character vector specifying the cells to include in the plot. Default is NULL.
- flip
Logical indicating whether to flip the plot.
- NA_color
The color to use for missing values.
- NA_stat
Logical indicating whether to include missing values in the plot.
- keep_empty
Logical indicating whether to keep empty groups in the plot.
- individual
Logical indicating whether to plot individual groups separately.
- stat_level
The level(s) of the variable(s) specified in
stat.byto include in the plot.- plot_type
The type of plot to create. Can be one of "bar", "rose", "ring", "pie", "trend", "area", "dot", "sankey", "chord", "venn", or "upset".
- stat_type
The type of statistic to compute for the plot. Can be one of "percent" or "count".
- position
The position adjustment for the plot. Can be one of "stack" or "dodge".
- palette
The name of the color palette to use for the plot.
- palcolor
The color to use in the color palette.
- alpha
The transparency level for the plot.
- bg_palette
The name of the background color palette to use for bar plots.
- bg_palcolor
The color to use in the background color palette.
- bg_alpha
The transparency level for the background color in bar plots.
- label
Logical indicating whether to add labels on the plot.
- label.size
The size of the labels.
- label.fg
The foreground color of the labels.
- label.bg
The background color of the labels.
- label.bg.r
The radius of the rounded corners of the label background.
- aspect.ratio
The aspect ratio of the plot.
- title
The main title of the plot.
- subtitle
The subtitle of the plot.
- xlab
The x-axis label of the plot.
- ylab
The y-axis label of the plot.
- legend.position
The position of the legend in the plot. Can be one of "right", "left", "bottom", "top", or "none".
- legend.direction
The direction of the legend in the plot. Can be one of "vertical" or "horizontal".
- theme_use
The name of the theme to use for the plot. Can be one of the predefined themes or a custom theme.
- theme_args
A list of arguments to be passed to the theme function.
- combine
Logical indicating whether to combine multiple plots into a single plot.
- nrow
The number of rows in the combined plot.
- ncol
The number of columns in the combined plot.
- byrow
Logical indicating whether to fill the plot by row or by column.
- force
Logical indicating whether to force the plot even if some variables have more than 100 levels.
- seed
The random seed to use for reproducible results.
Examples
data("pancreas_sub")
CellStatPlot(pancreas_sub, stat.by = "Phase", group.by = "SubCellType", label = TRUE)
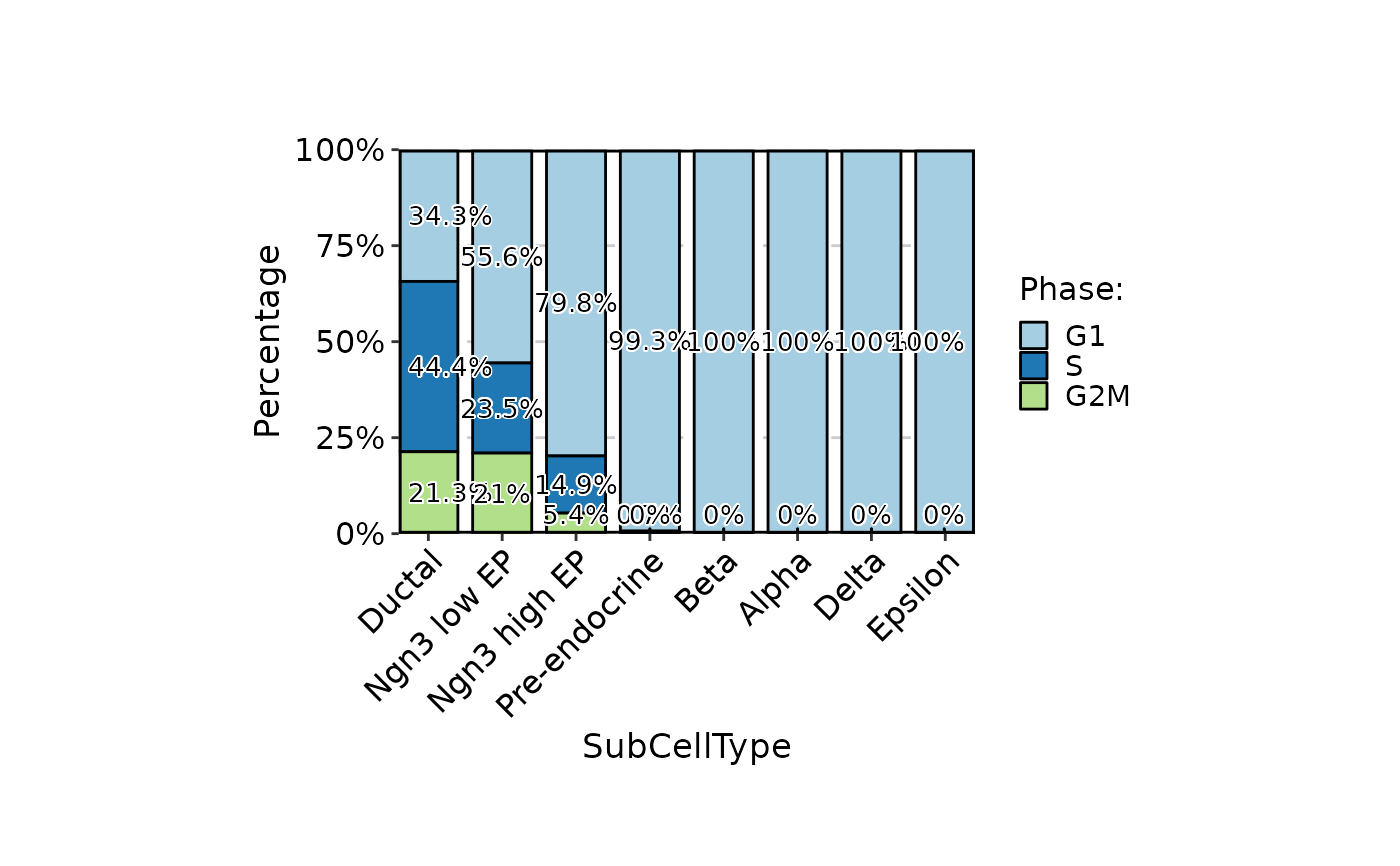
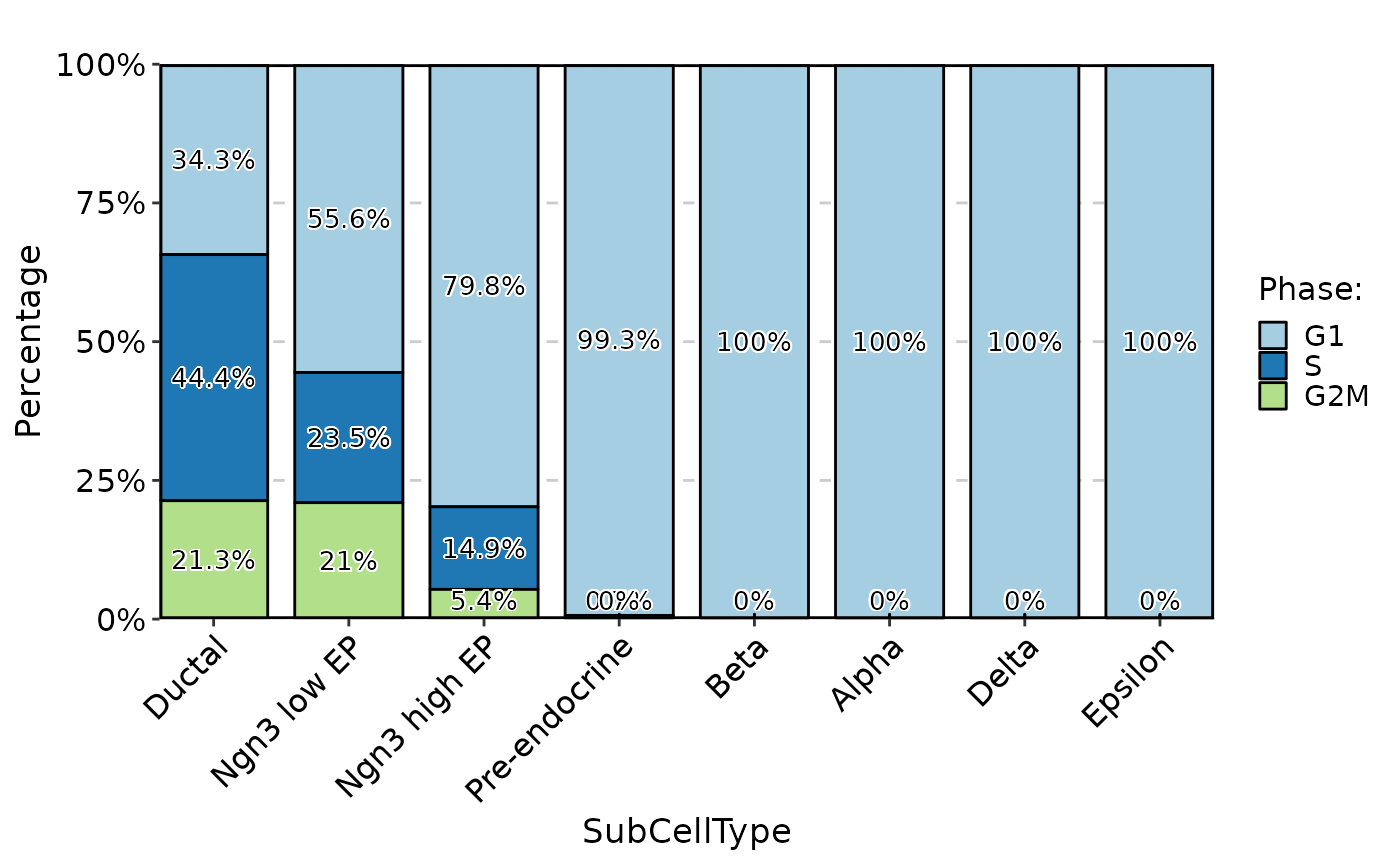 CellStatPlot(pancreas_sub, stat.by = "Phase", group.by = "SubCellType", label = TRUE) %>% panel_fix(height = 2, width = 3)
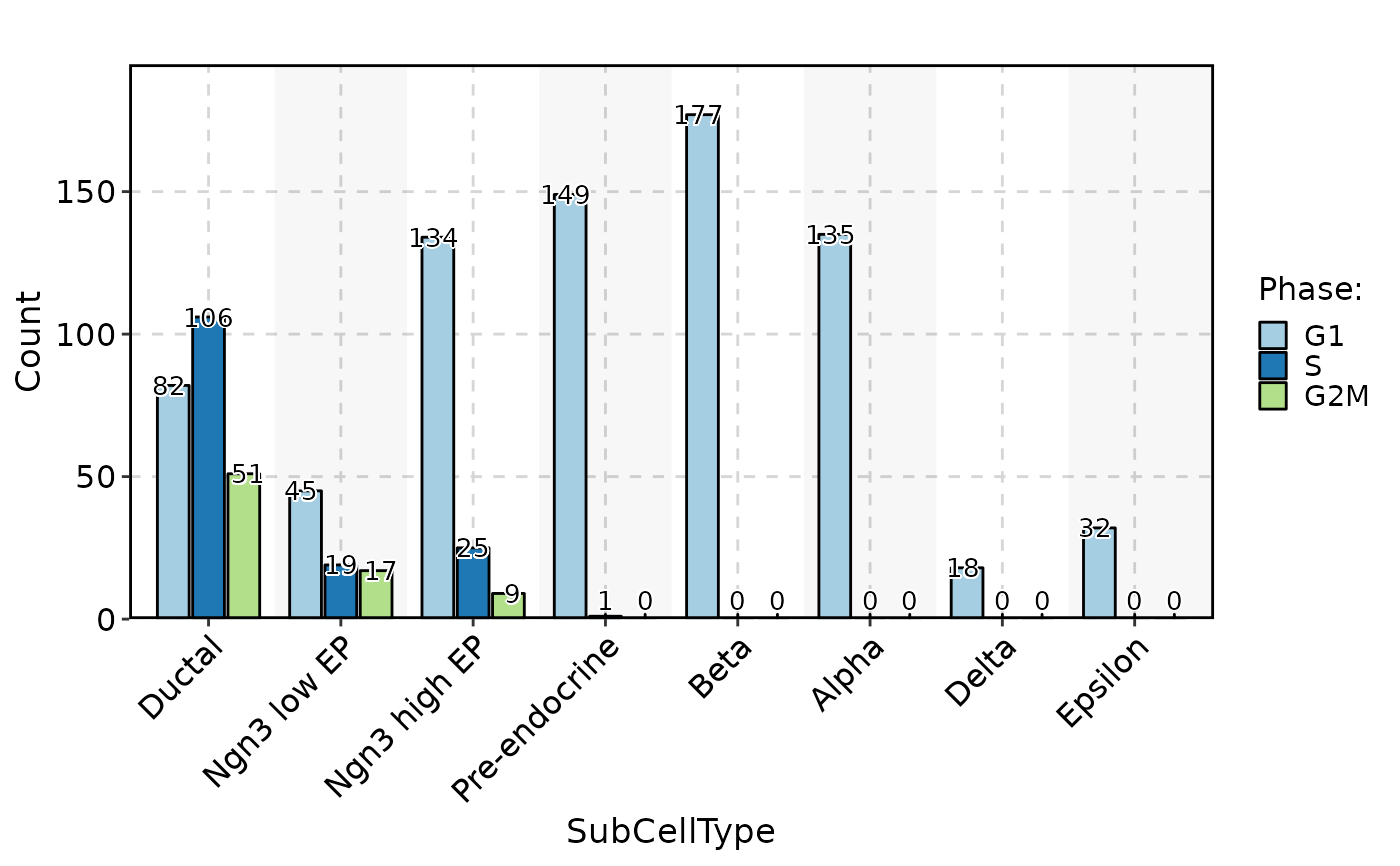
 CellStatPlot(pancreas_sub, stat.by = "Phase", group.by = "SubCellType", stat_type = "count", position = "dodge", label = TRUE)
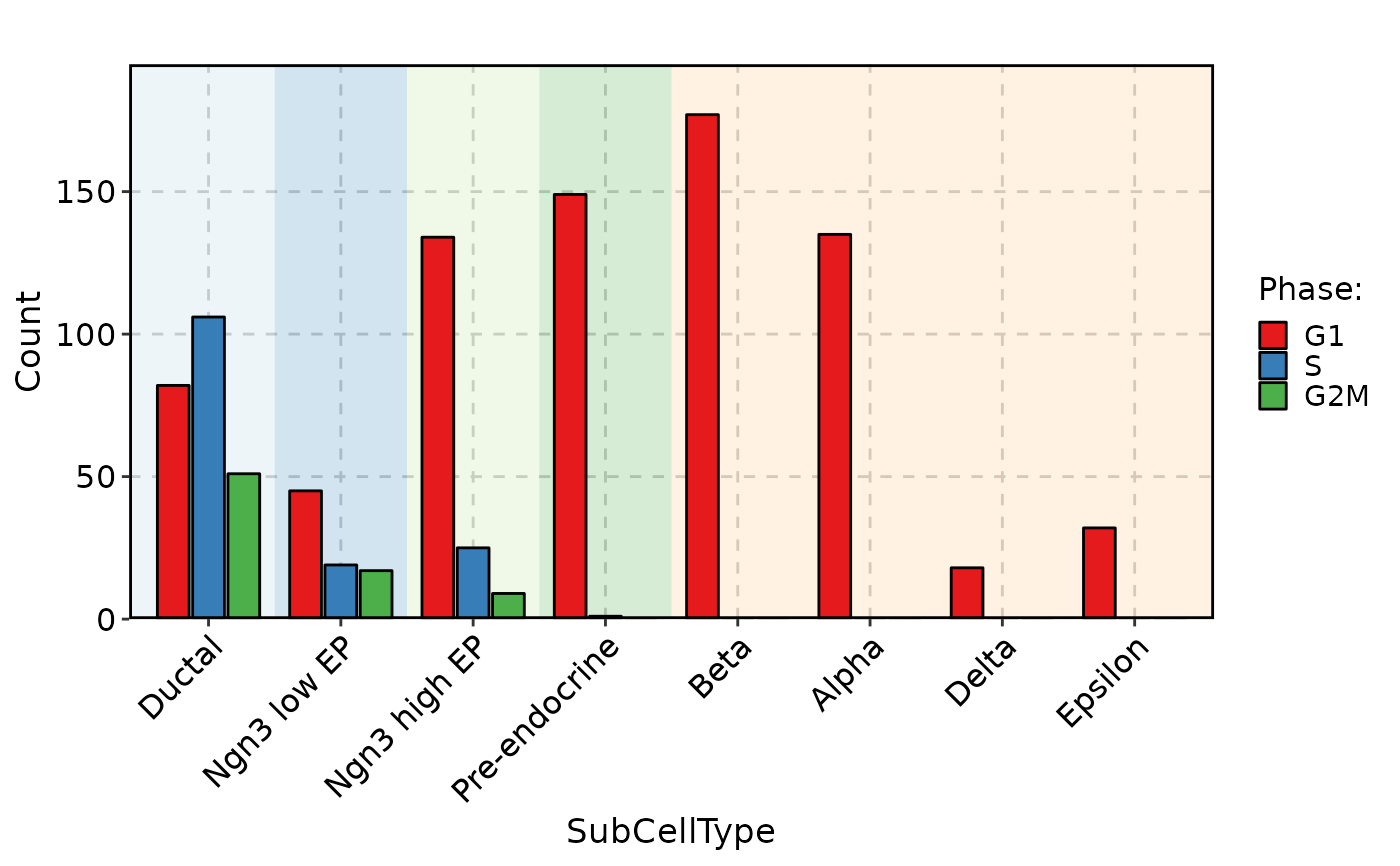
 CellStatPlot(pancreas_sub, stat.by = "Phase", group.by = "SubCellType", bg.by = "CellType", palette = "Set1", stat_type = "count", position = "dodge")
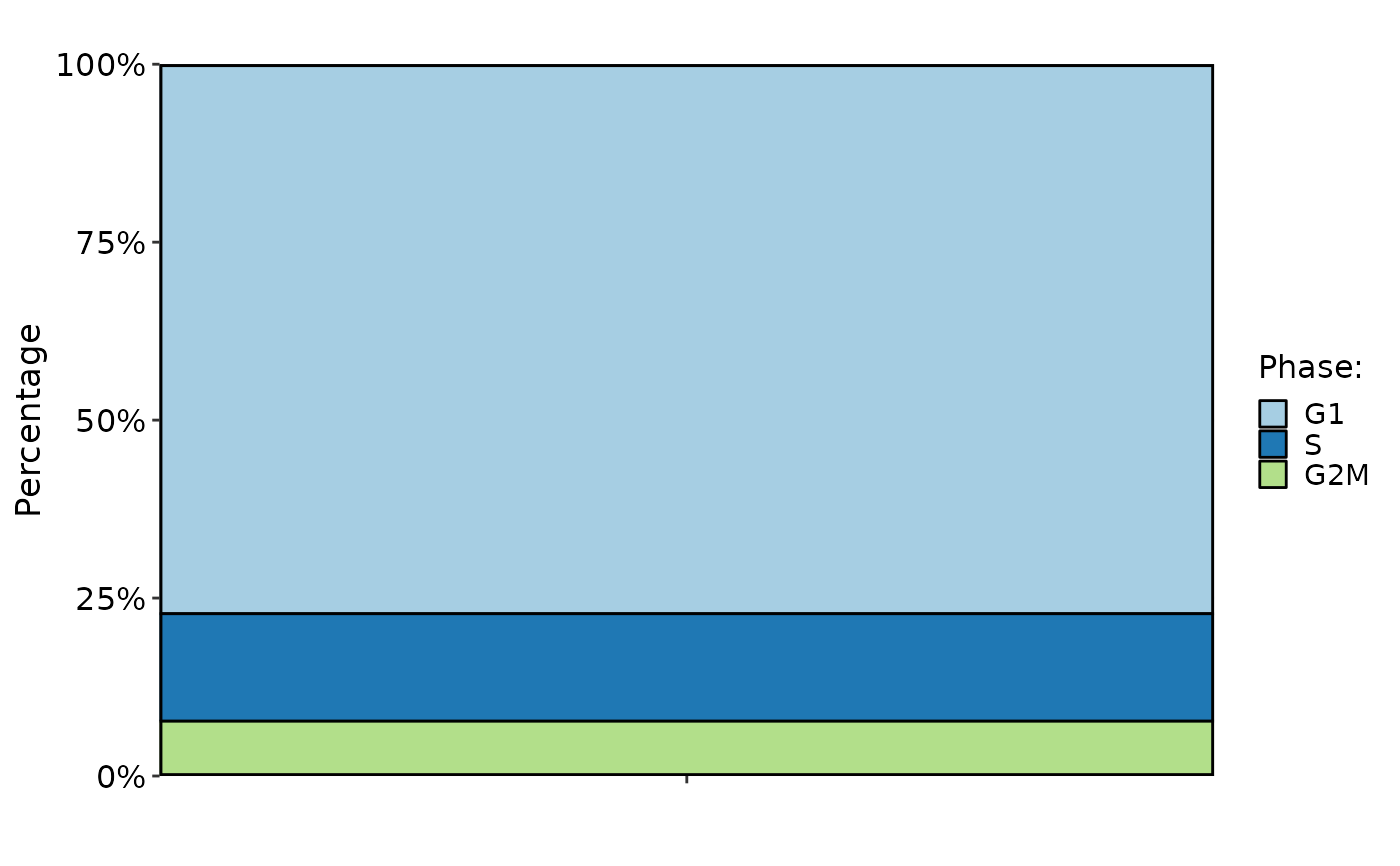
 CellStatPlot(pancreas_sub, stat.by = "Phase", plot_type = "bar")
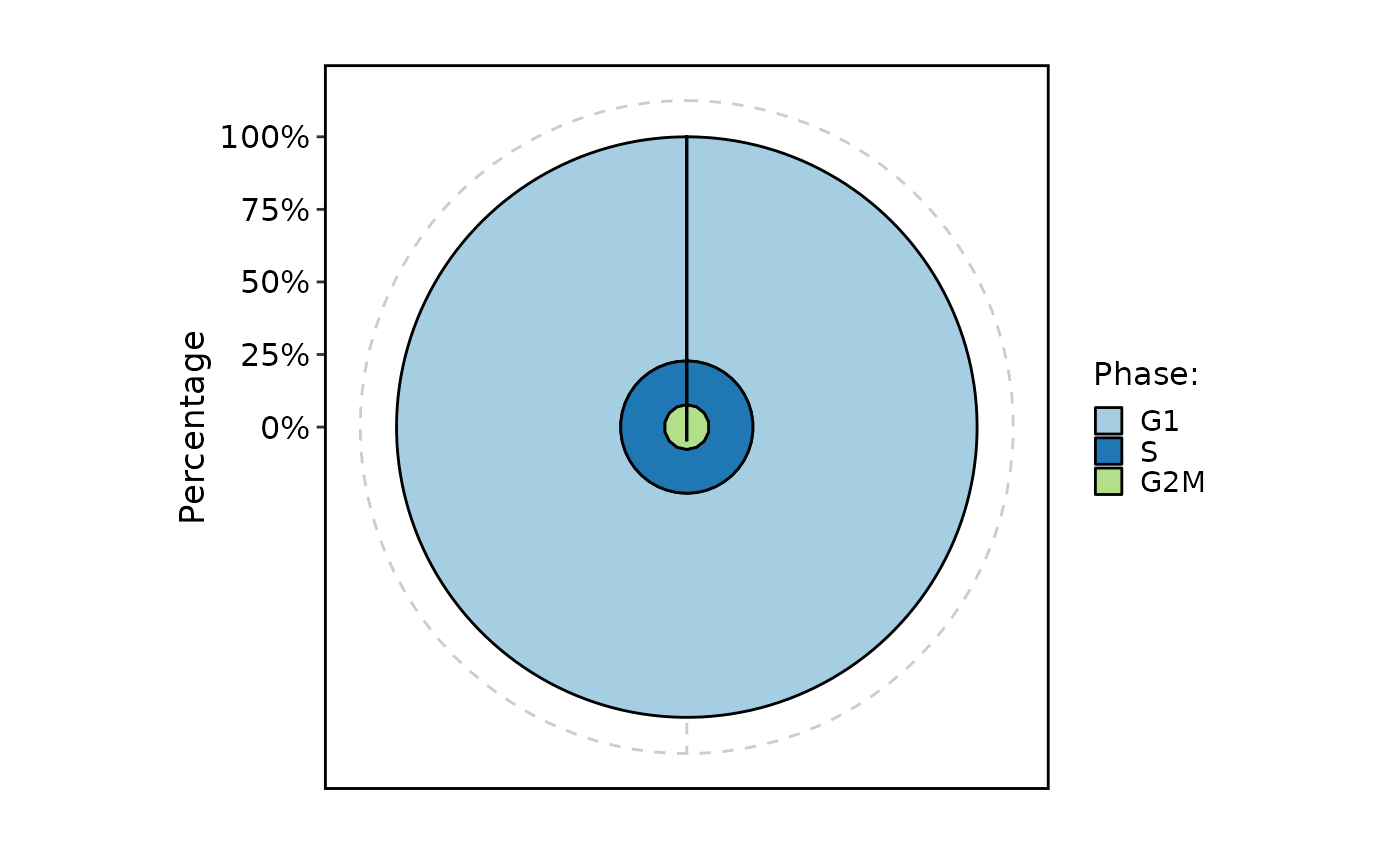
 CellStatPlot(pancreas_sub, stat.by = "Phase", plot_type = "rose")
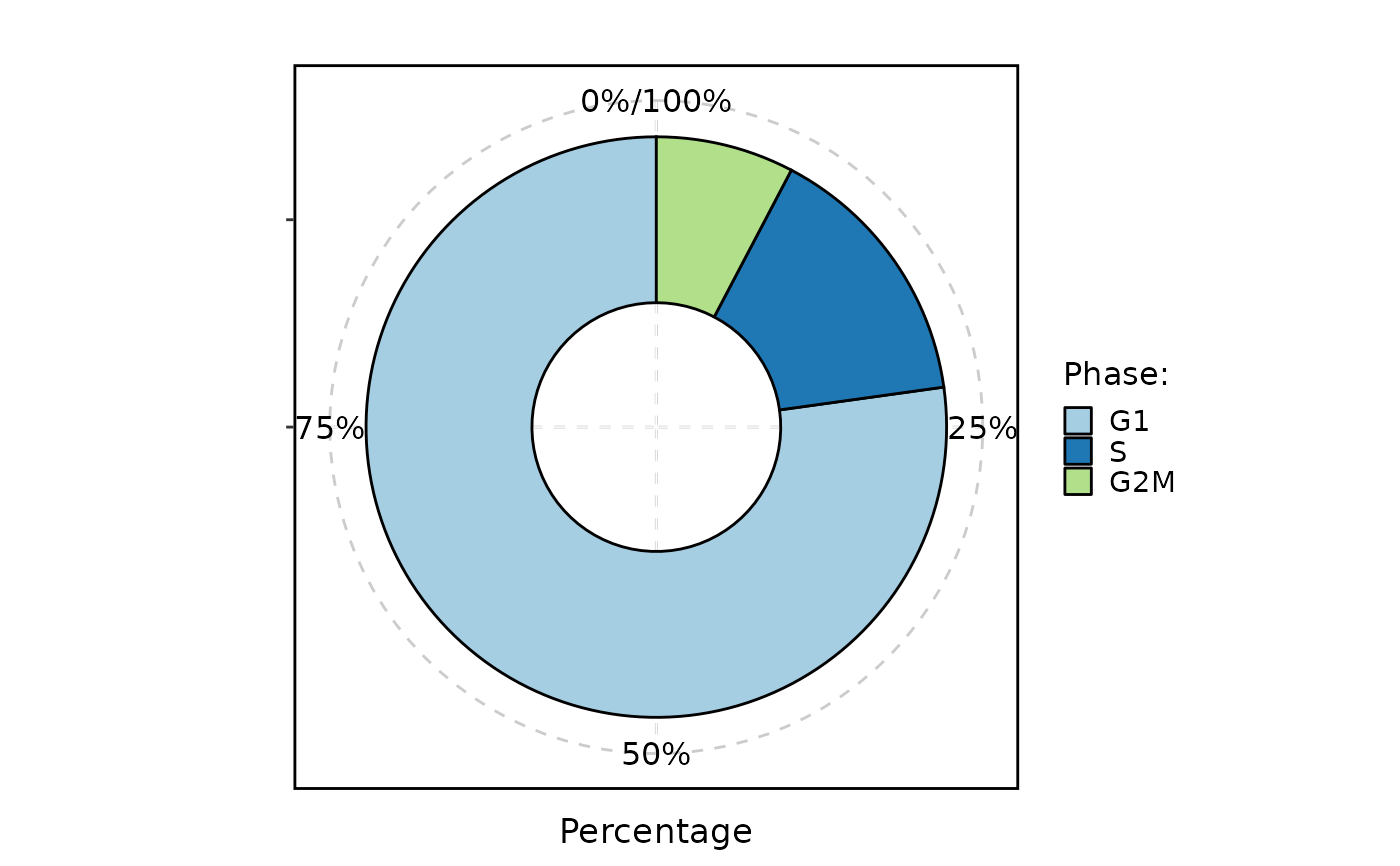
 CellStatPlot(pancreas_sub, stat.by = "Phase", plot_type = "ring")
#> Warning: Removed 1 rows containing missing values (`position_stack()`).
CellStatPlot(pancreas_sub, stat.by = "Phase", plot_type = "ring")
#> Warning: Removed 1 rows containing missing values (`position_stack()`).
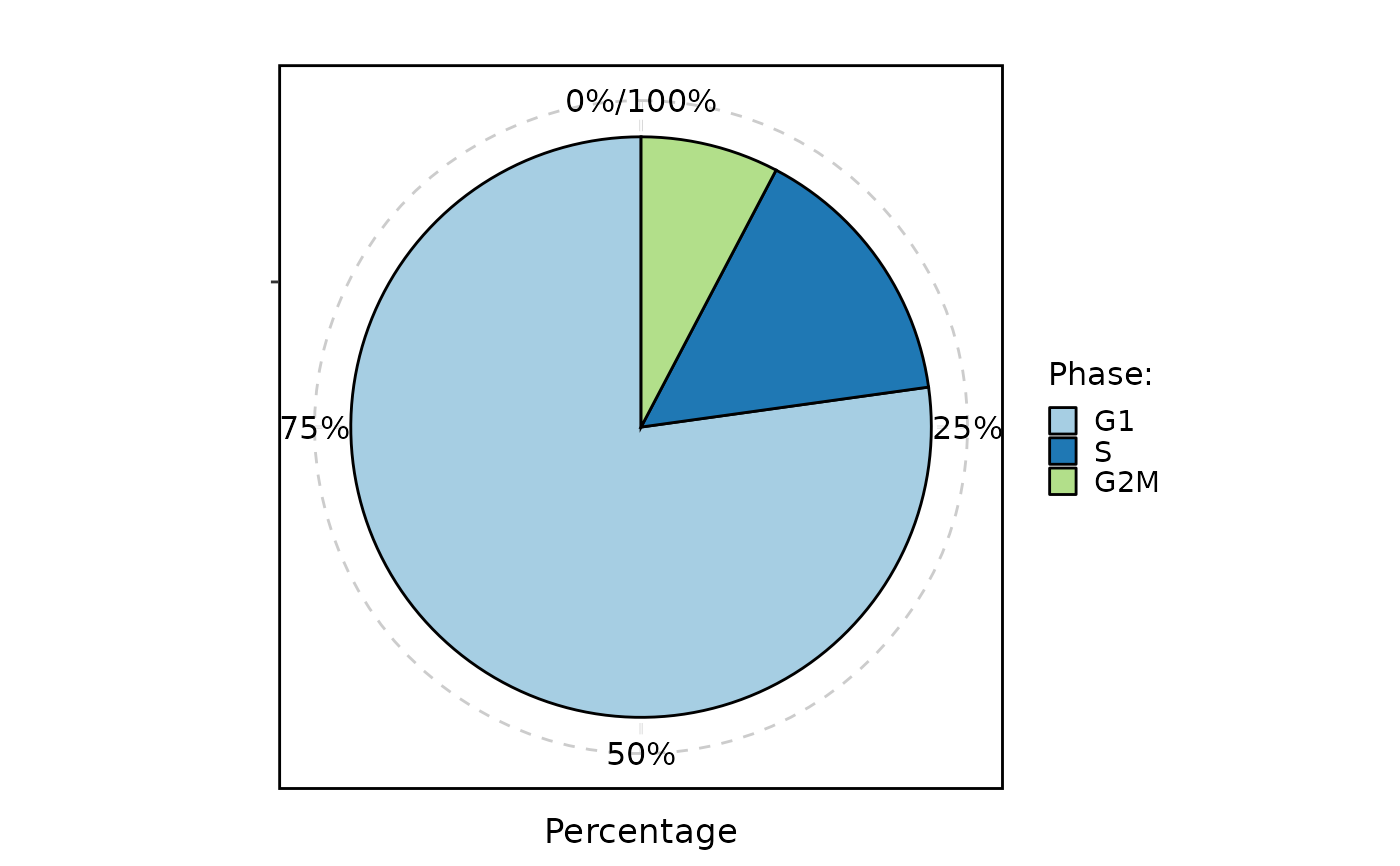
 CellStatPlot(pancreas_sub, stat.by = "Phase", plot_type = "pie")
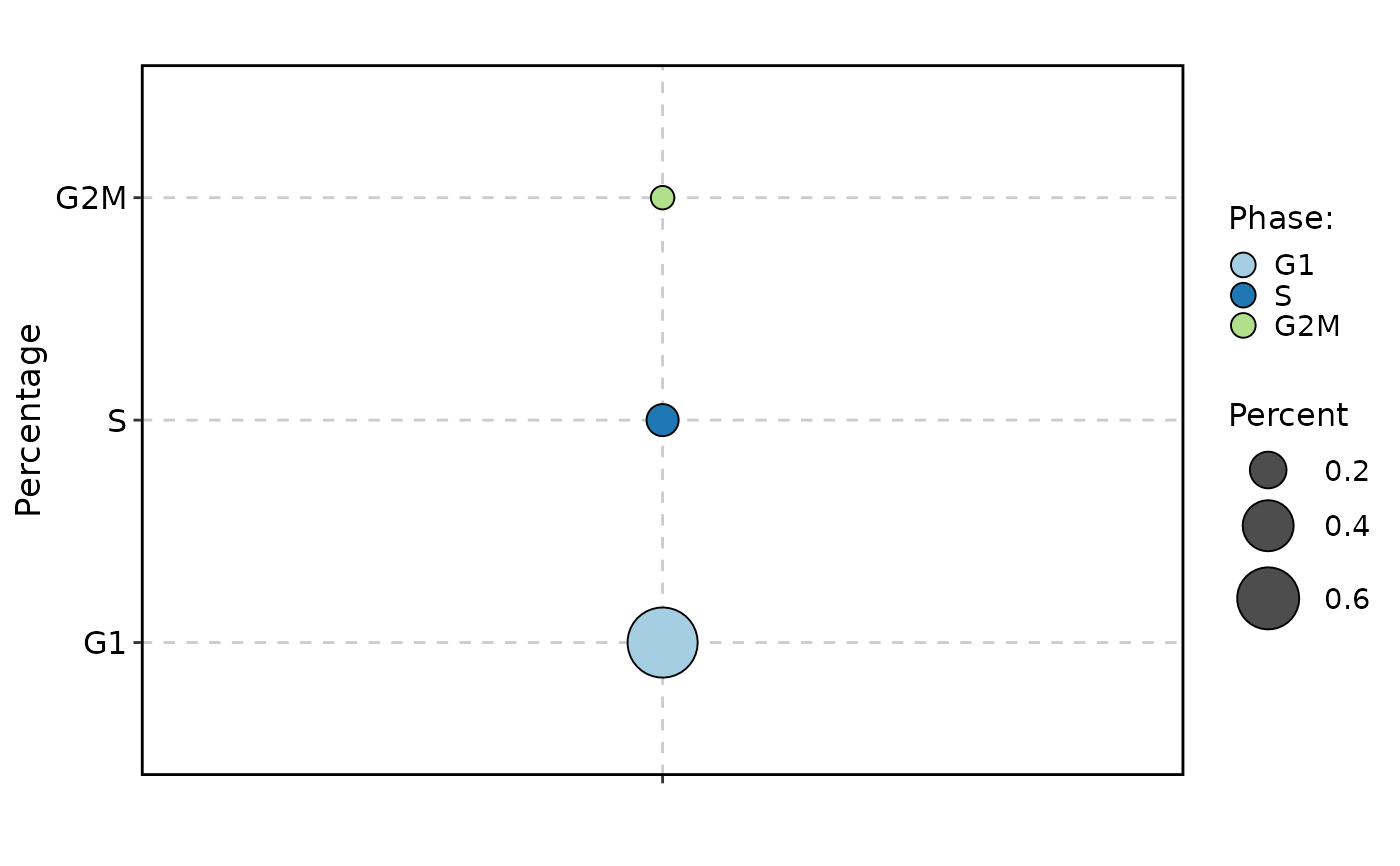
 CellStatPlot(pancreas_sub, stat.by = "Phase", plot_type = "dot")
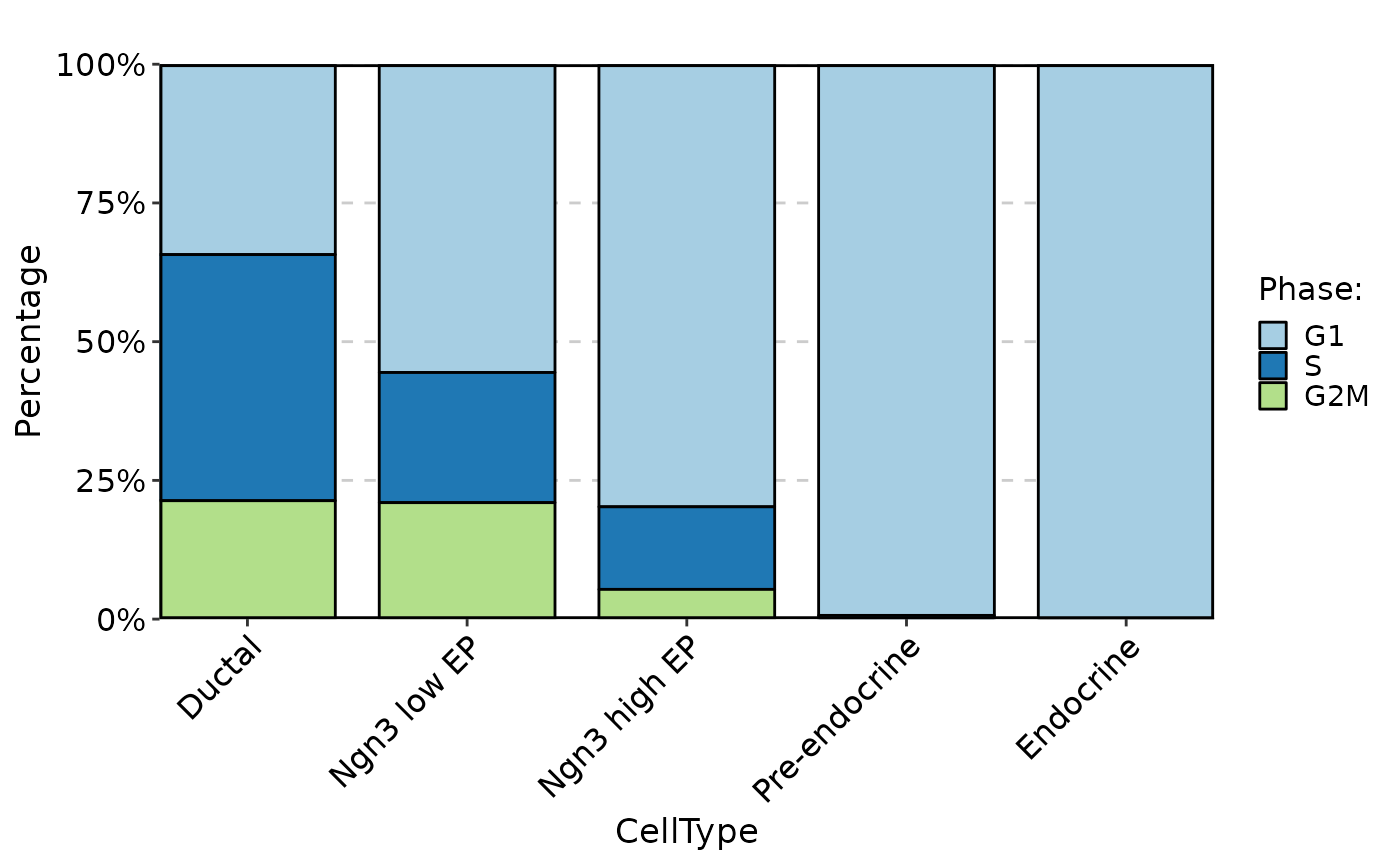
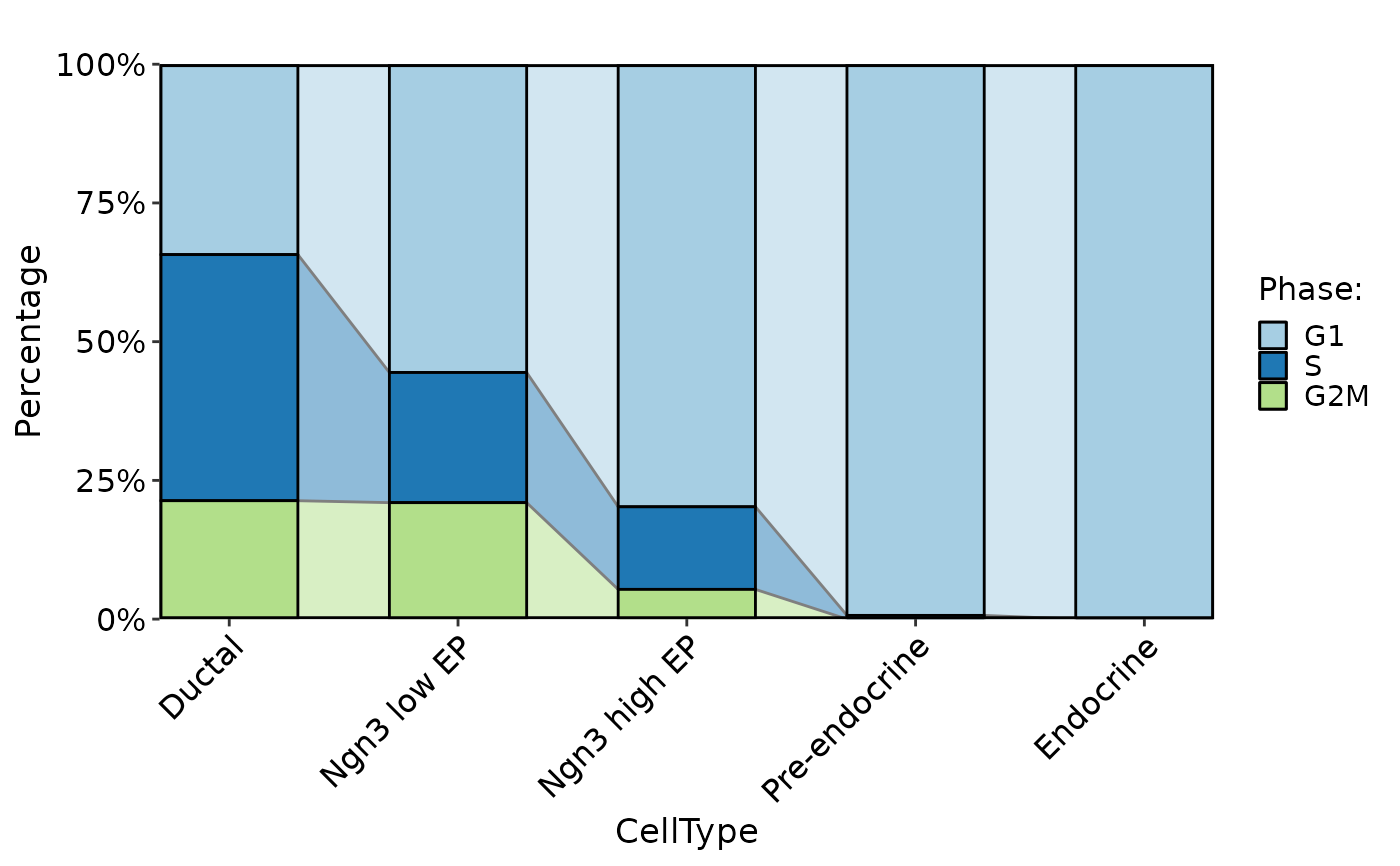
 CellStatPlot(pancreas_sub, stat.by = "Phase", group.by = "CellType", plot_type = "bar")
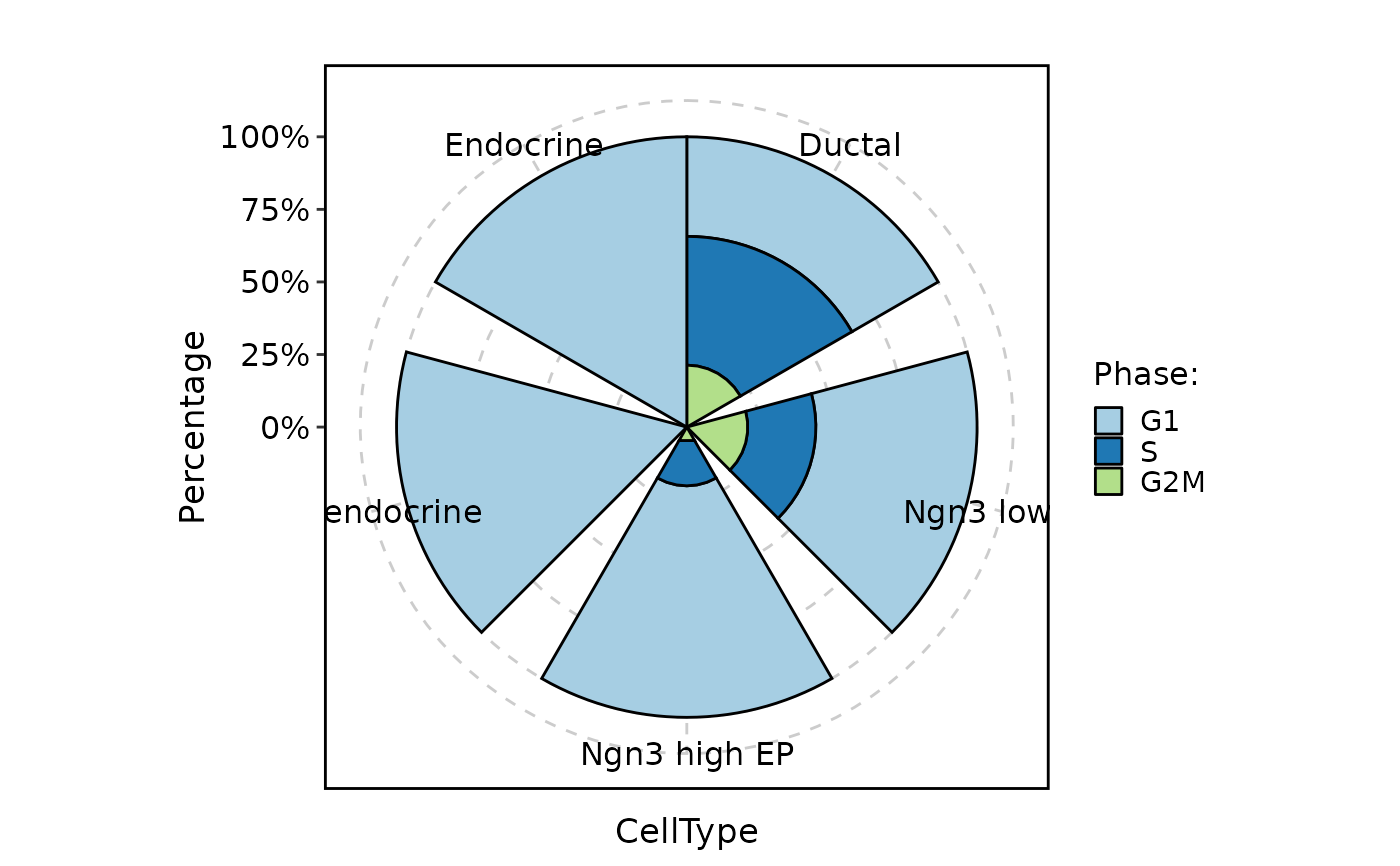
 CellStatPlot(pancreas_sub, stat.by = "Phase", group.by = "CellType", plot_type = "rose")
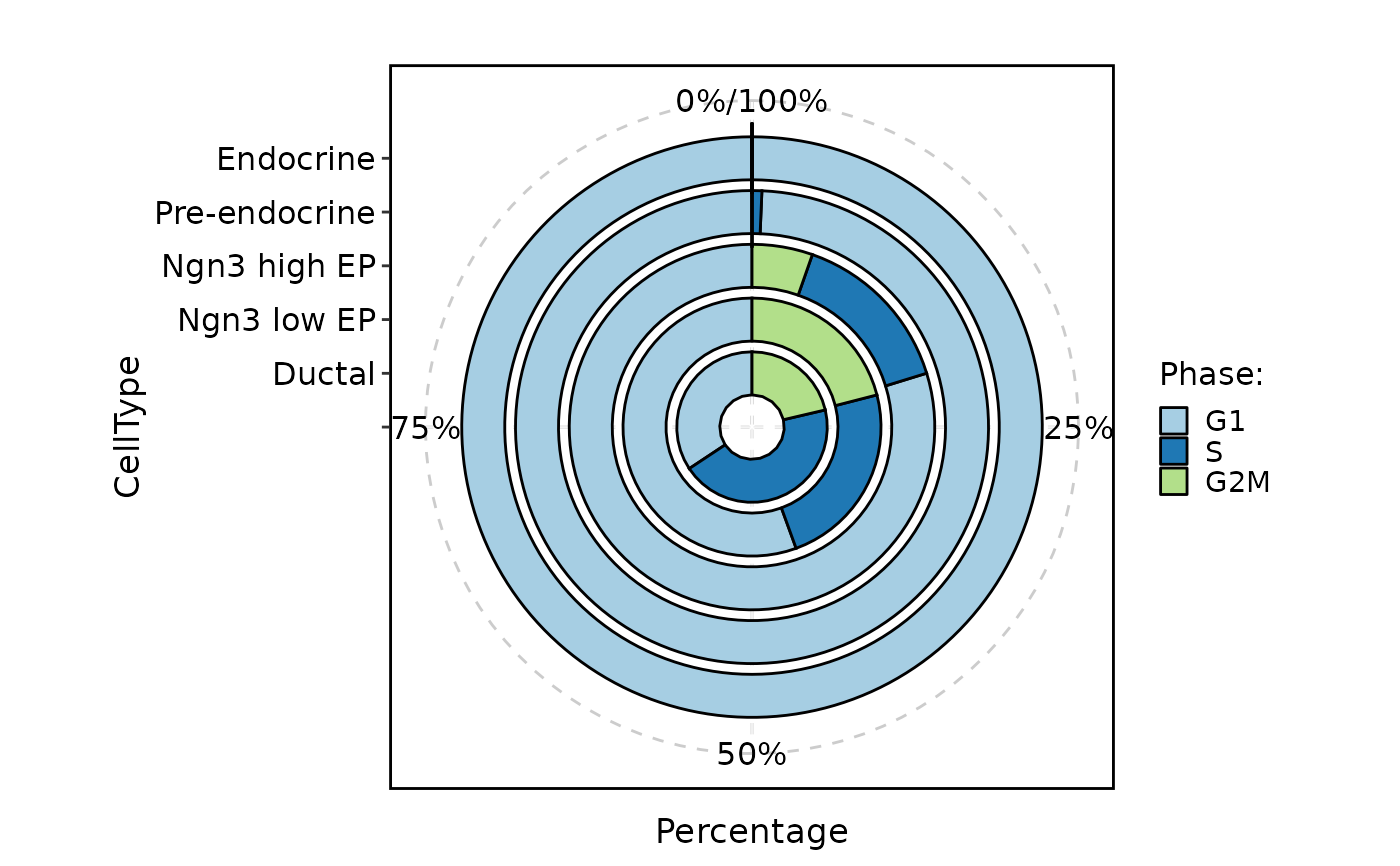
 CellStatPlot(pancreas_sub, stat.by = "Phase", group.by = "CellType", plot_type = "ring")
#> Warning: Removed 1 rows containing missing values (`position_stack()`).
CellStatPlot(pancreas_sub, stat.by = "Phase", group.by = "CellType", plot_type = "ring")
#> Warning: Removed 1 rows containing missing values (`position_stack()`).
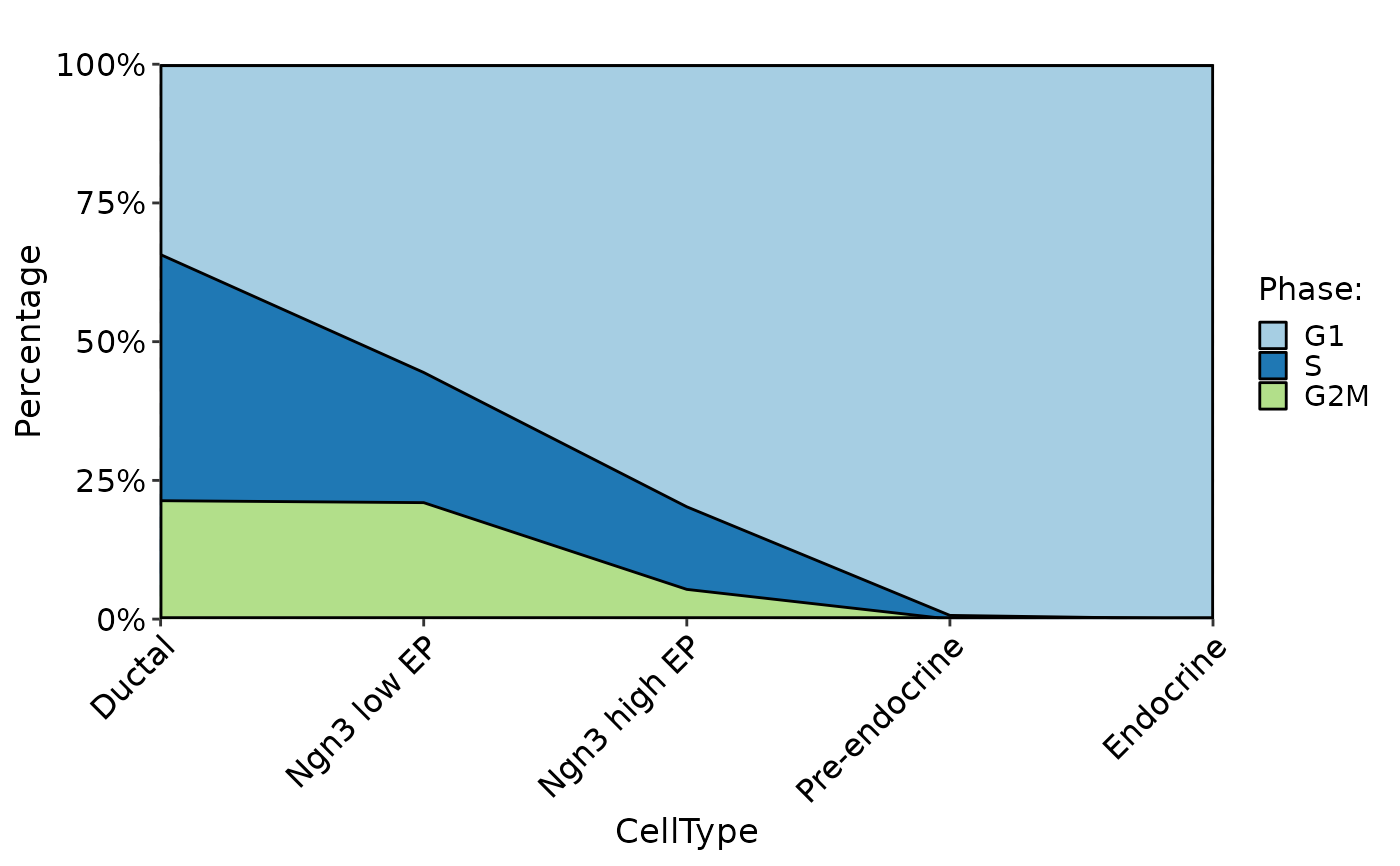
 CellStatPlot(pancreas_sub, stat.by = "Phase", group.by = "CellType", plot_type = "area")
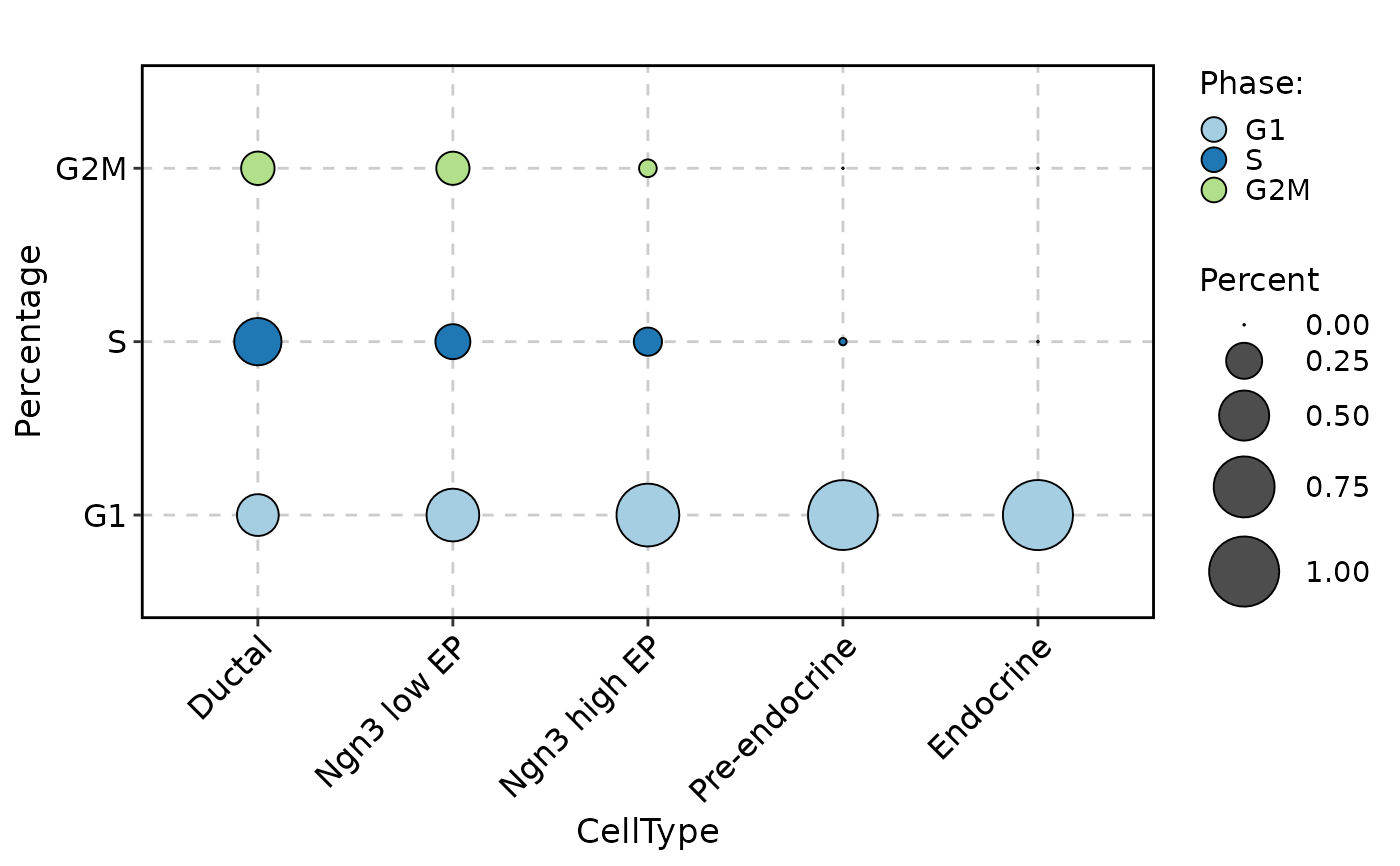
 CellStatPlot(pancreas_sub, stat.by = "Phase", group.by = "CellType", plot_type = "dot")
 CellStatPlot(pancreas_sub, stat.by = "Phase", group.by = "CellType", plot_type = "trend")
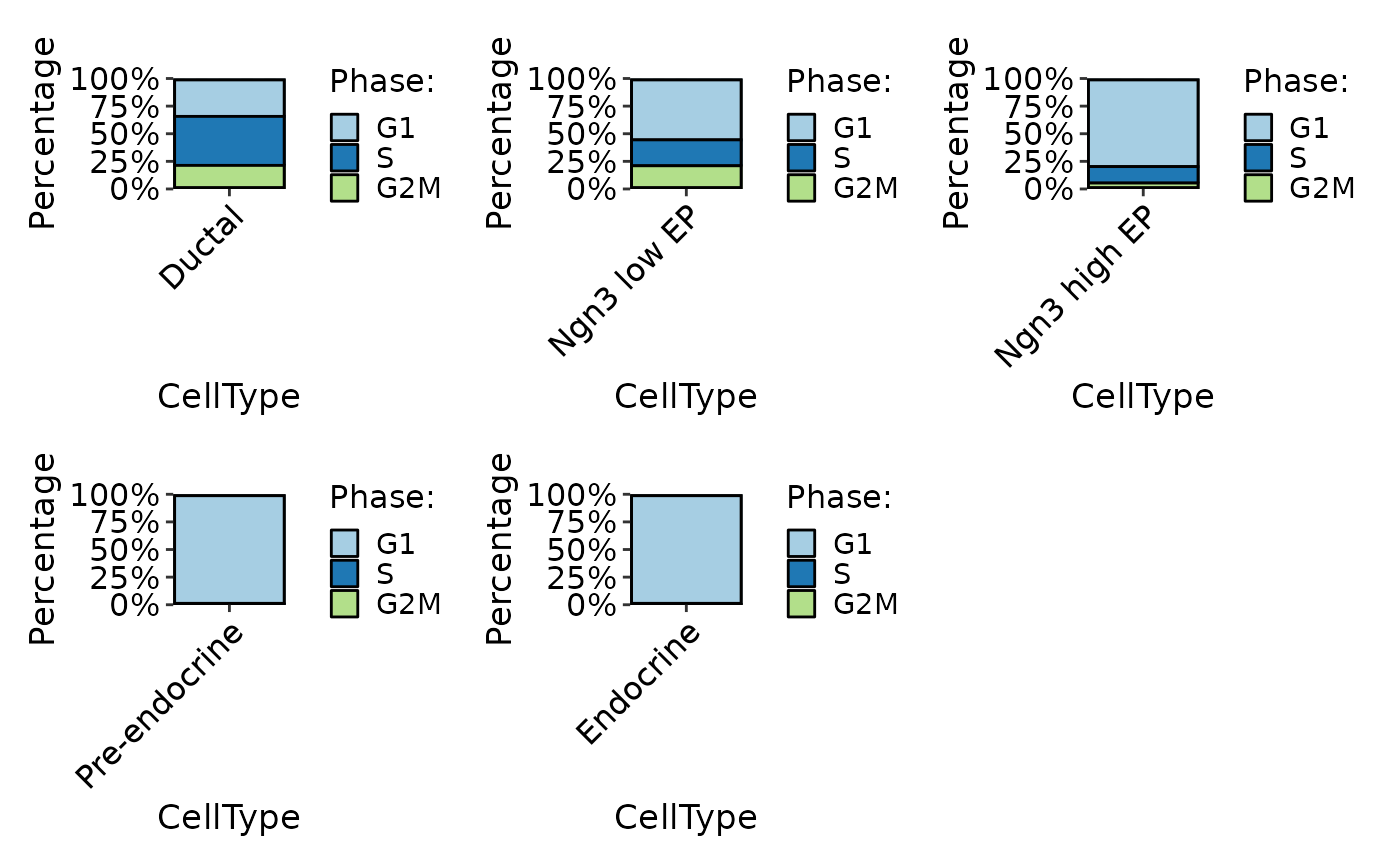
 CellStatPlot(pancreas_sub, stat.by = "Phase", group.by = "CellType", plot_type = "bar", individual = TRUE)
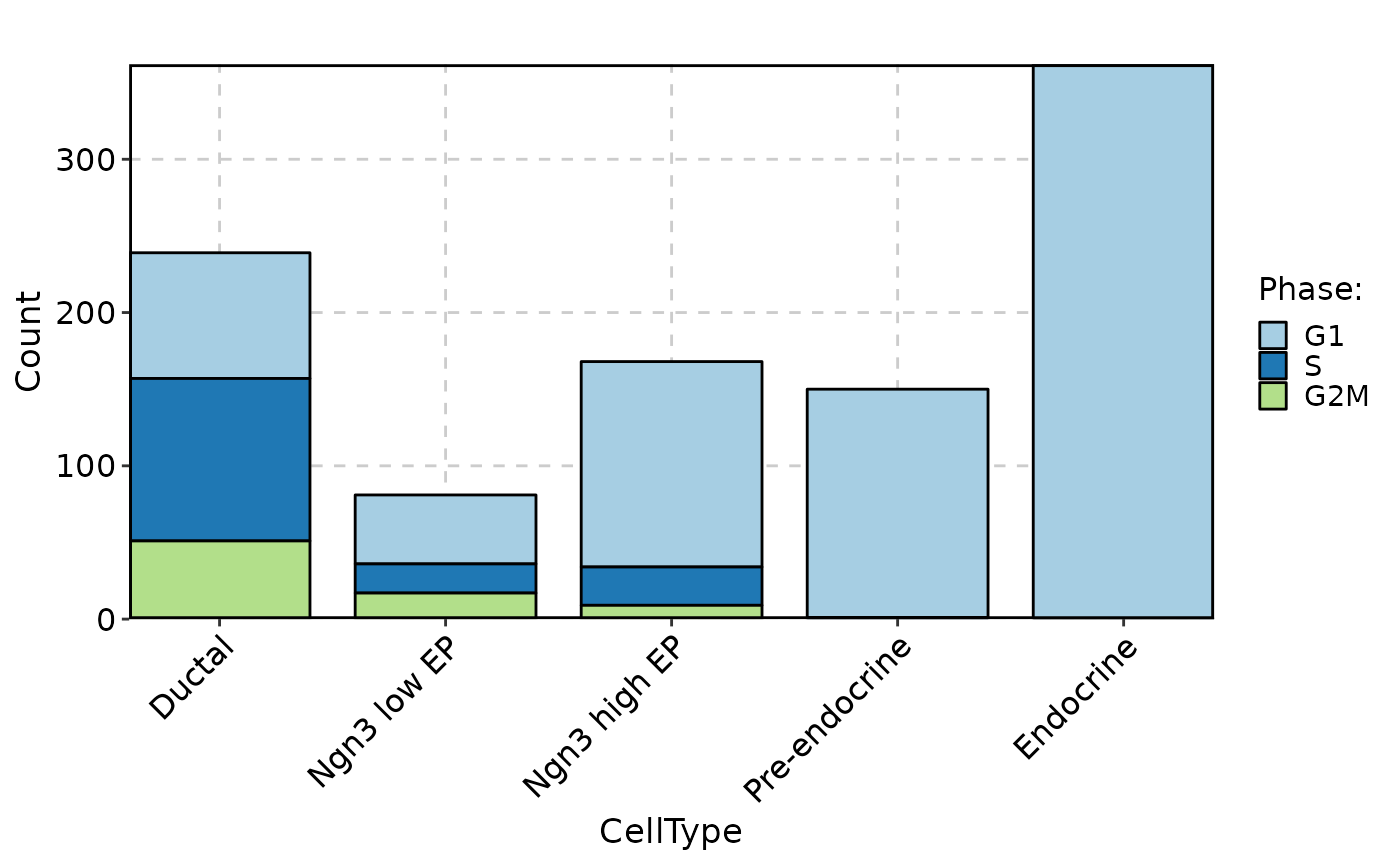
 CellStatPlot(pancreas_sub, stat.by = "Phase", group.by = "CellType", stat_type = "count", plot_type = "bar")
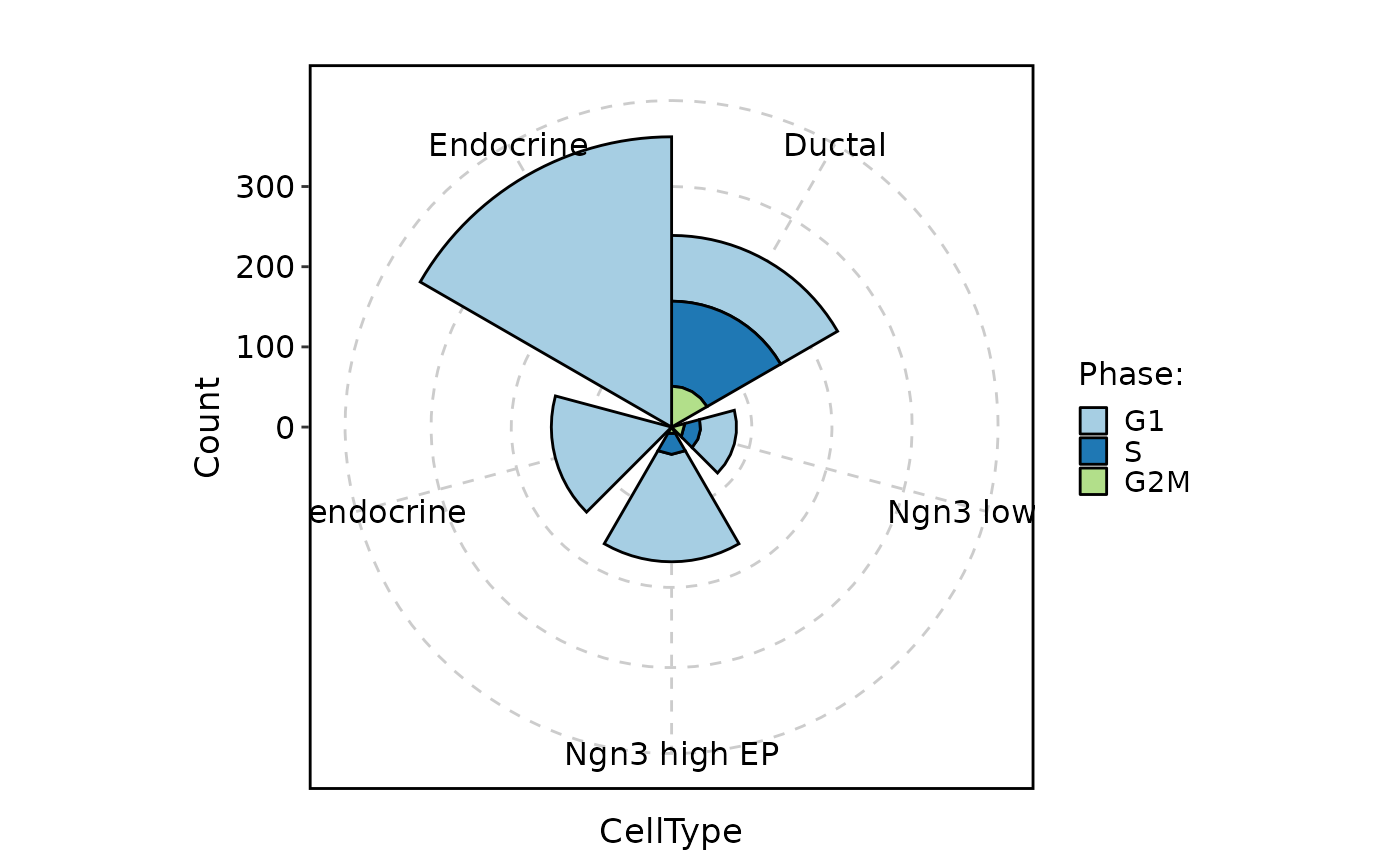
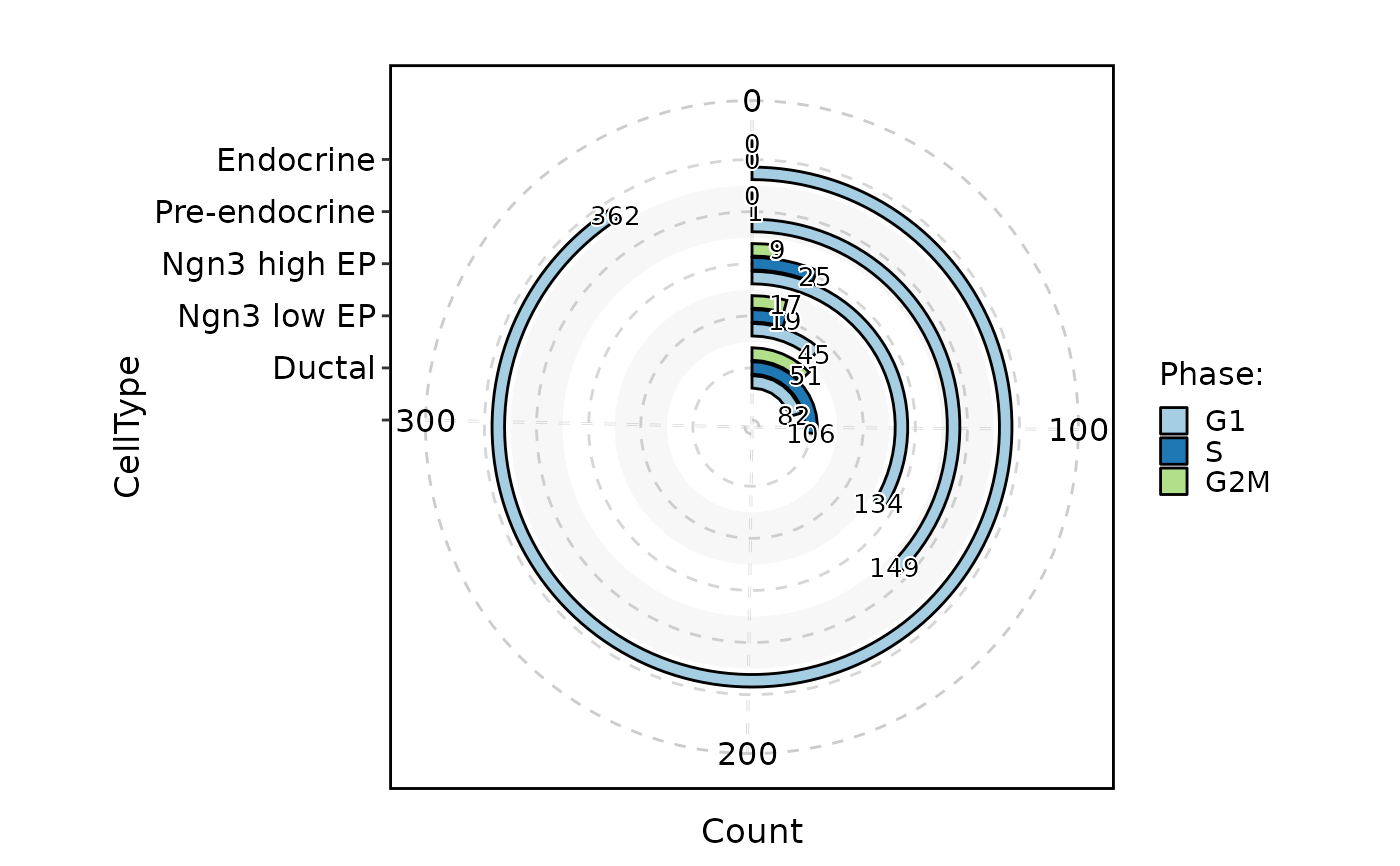
 CellStatPlot(pancreas_sub, stat.by = "Phase", group.by = "CellType", stat_type = "count", plot_type = "rose")
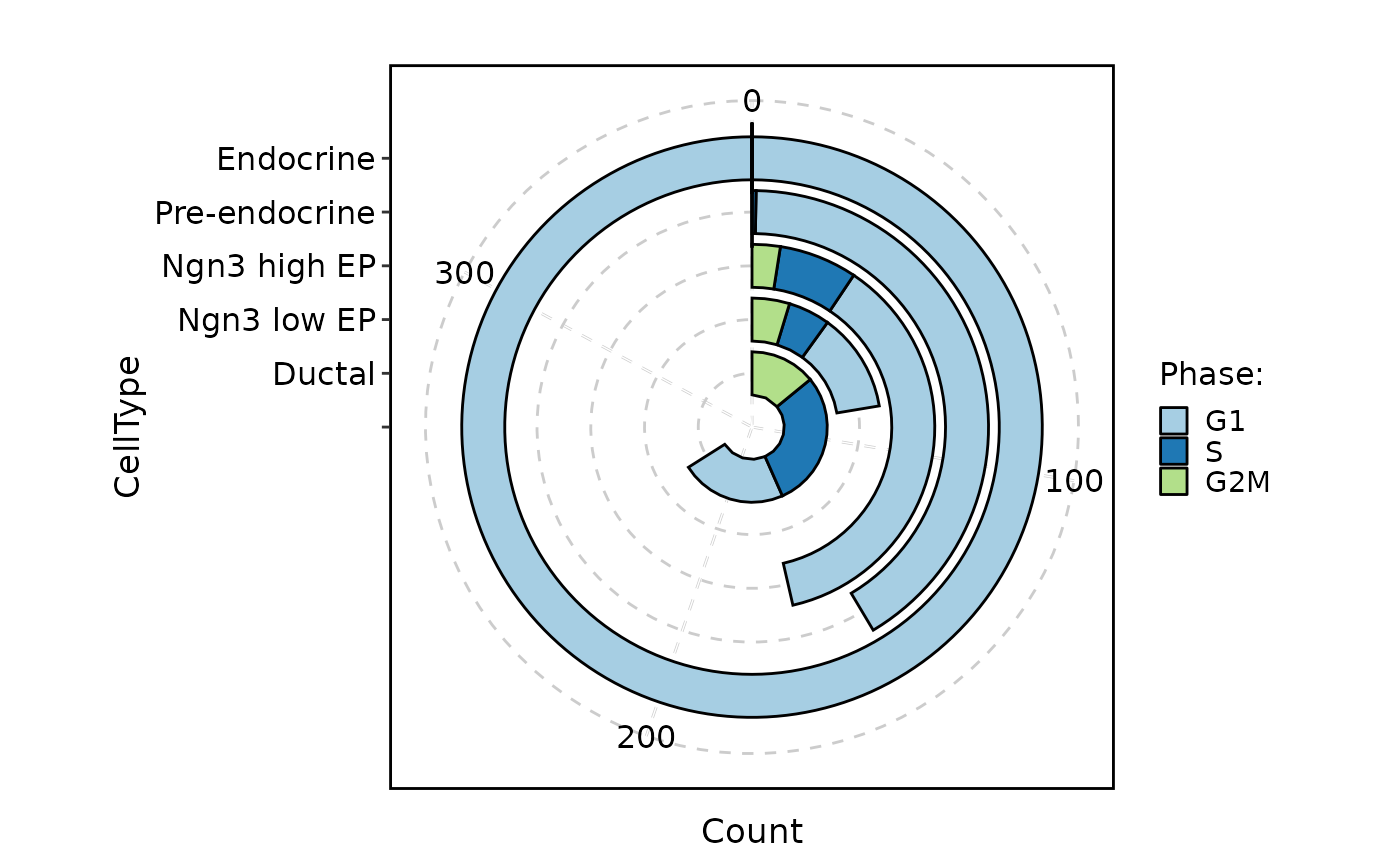
 CellStatPlot(pancreas_sub, stat.by = "Phase", group.by = "CellType", stat_type = "count", plot_type = "ring")
#> Warning: Removed 1 rows containing missing values (`position_stack()`).
CellStatPlot(pancreas_sub, stat.by = "Phase", group.by = "CellType", stat_type = "count", plot_type = "ring")
#> Warning: Removed 1 rows containing missing values (`position_stack()`).
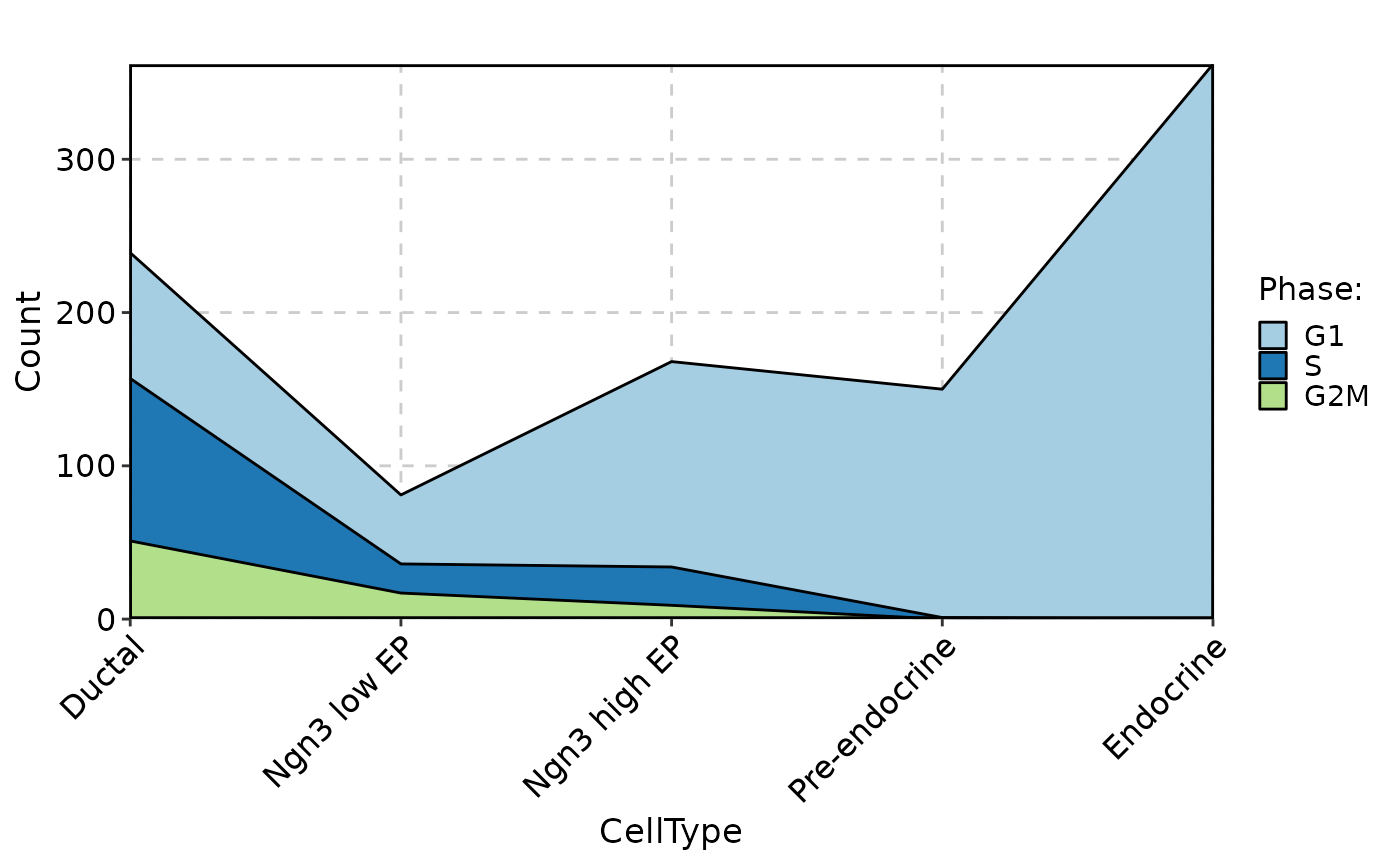
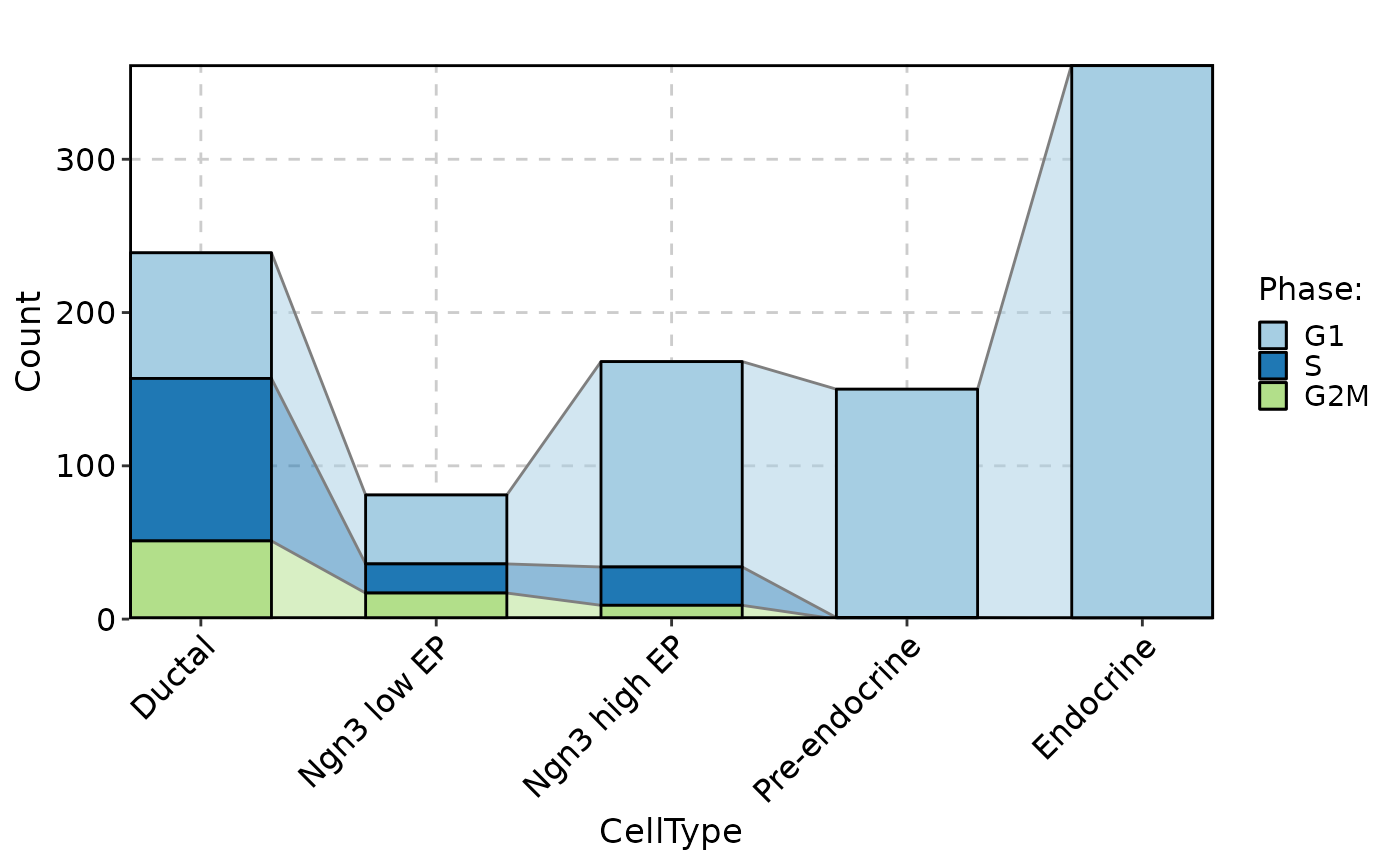
 CellStatPlot(pancreas_sub, stat.by = "Phase", group.by = "CellType", stat_type = "count", plot_type = "area")
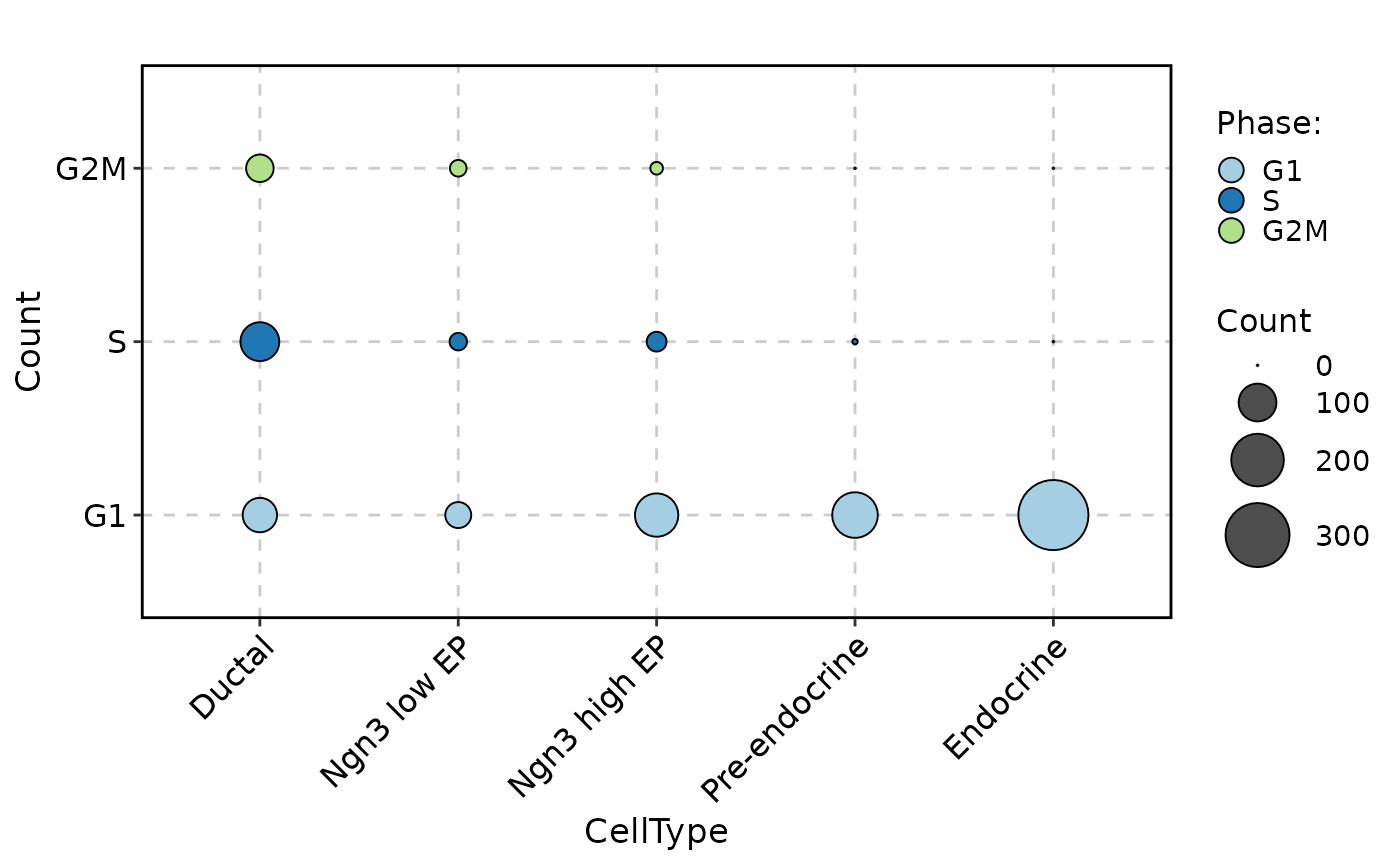
 CellStatPlot(pancreas_sub, stat.by = "Phase", group.by = "CellType", stat_type = "count", plot_type = "dot")
 CellStatPlot(pancreas_sub, stat.by = "Phase", group.by = "CellType", stat_type = "count", plot_type = "trend")
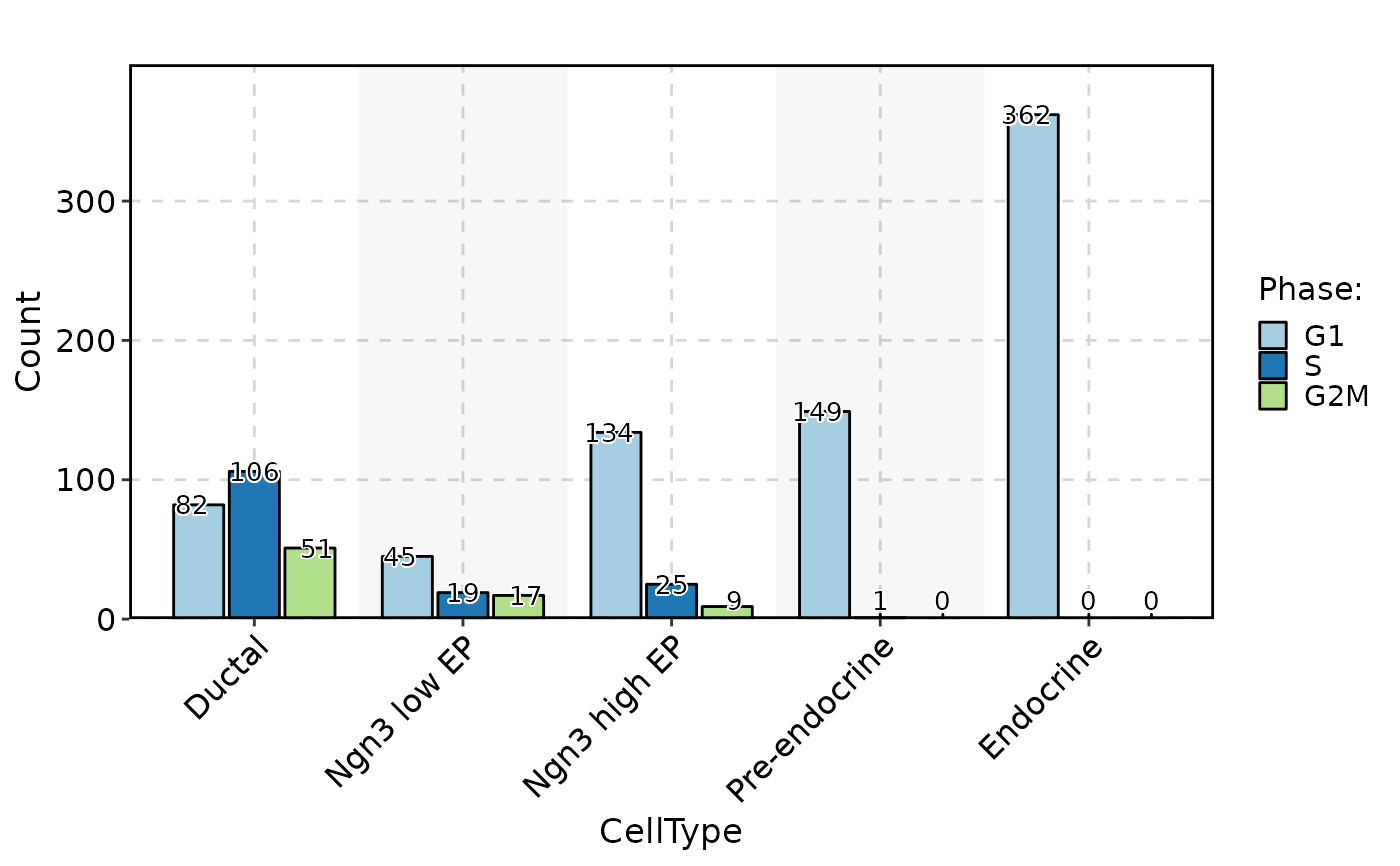
 CellStatPlot(pancreas_sub, stat.by = "Phase", group.by = "CellType", stat_type = "count", plot_type = "bar", position = "dodge", label = TRUE)
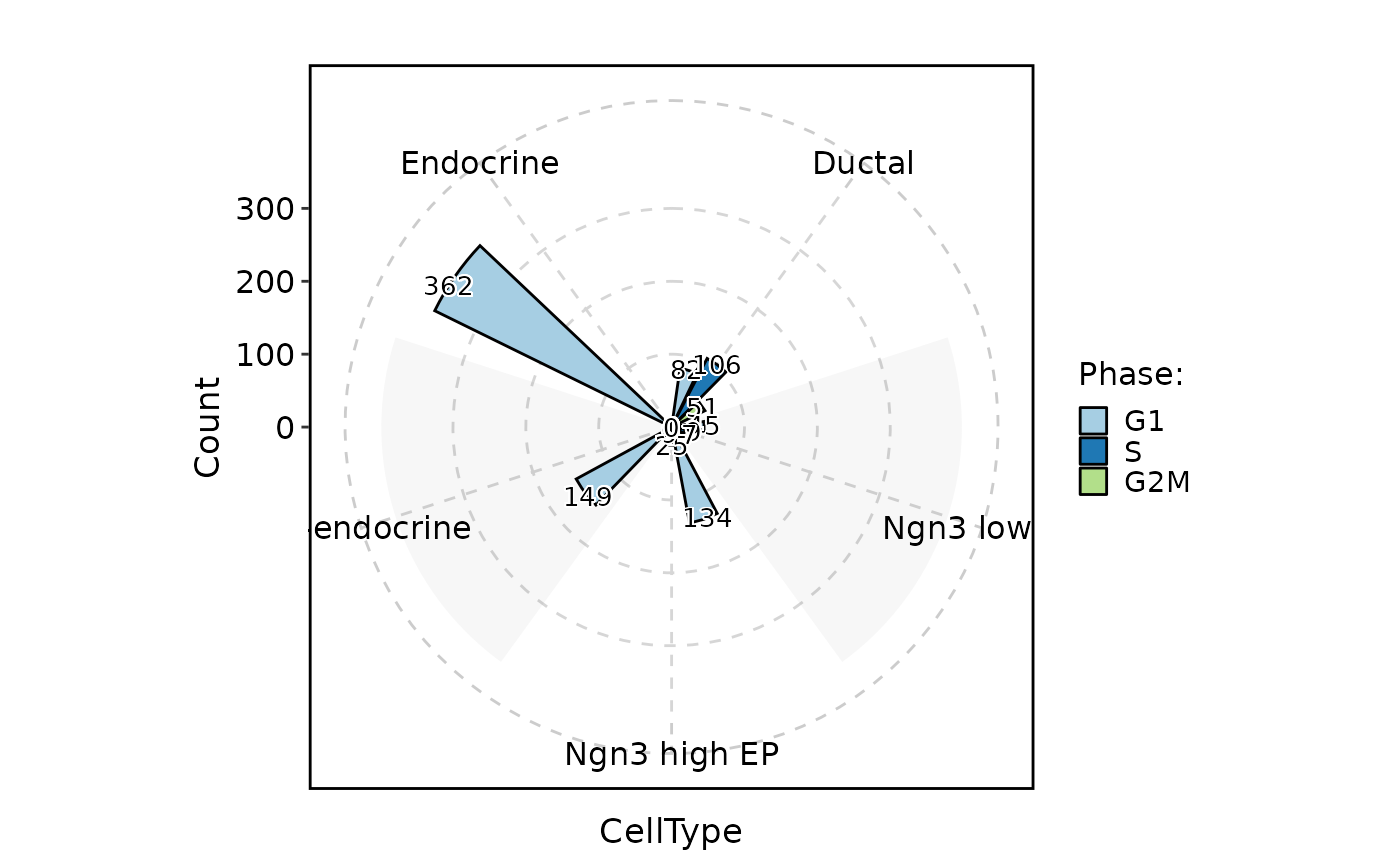
 CellStatPlot(pancreas_sub, stat.by = "Phase", group.by = "CellType", stat_type = "count", plot_type = "rose", position = "dodge", label = TRUE)
 CellStatPlot(pancreas_sub, stat.by = "Phase", group.by = "CellType", stat_type = "count", plot_type = "ring", position = "dodge", label = TRUE)
#> Warning: Removed 1 rows containing missing values (`geom_col()`).
#> Warning: Removed 1 rows containing missing values (`geom_text_repel()`).
CellStatPlot(pancreas_sub, stat.by = "Phase", group.by = "CellType", stat_type = "count", plot_type = "ring", position = "dodge", label = TRUE)
#> Warning: Removed 1 rows containing missing values (`geom_col()`).
#> Warning: Removed 1 rows containing missing values (`geom_text_repel()`).
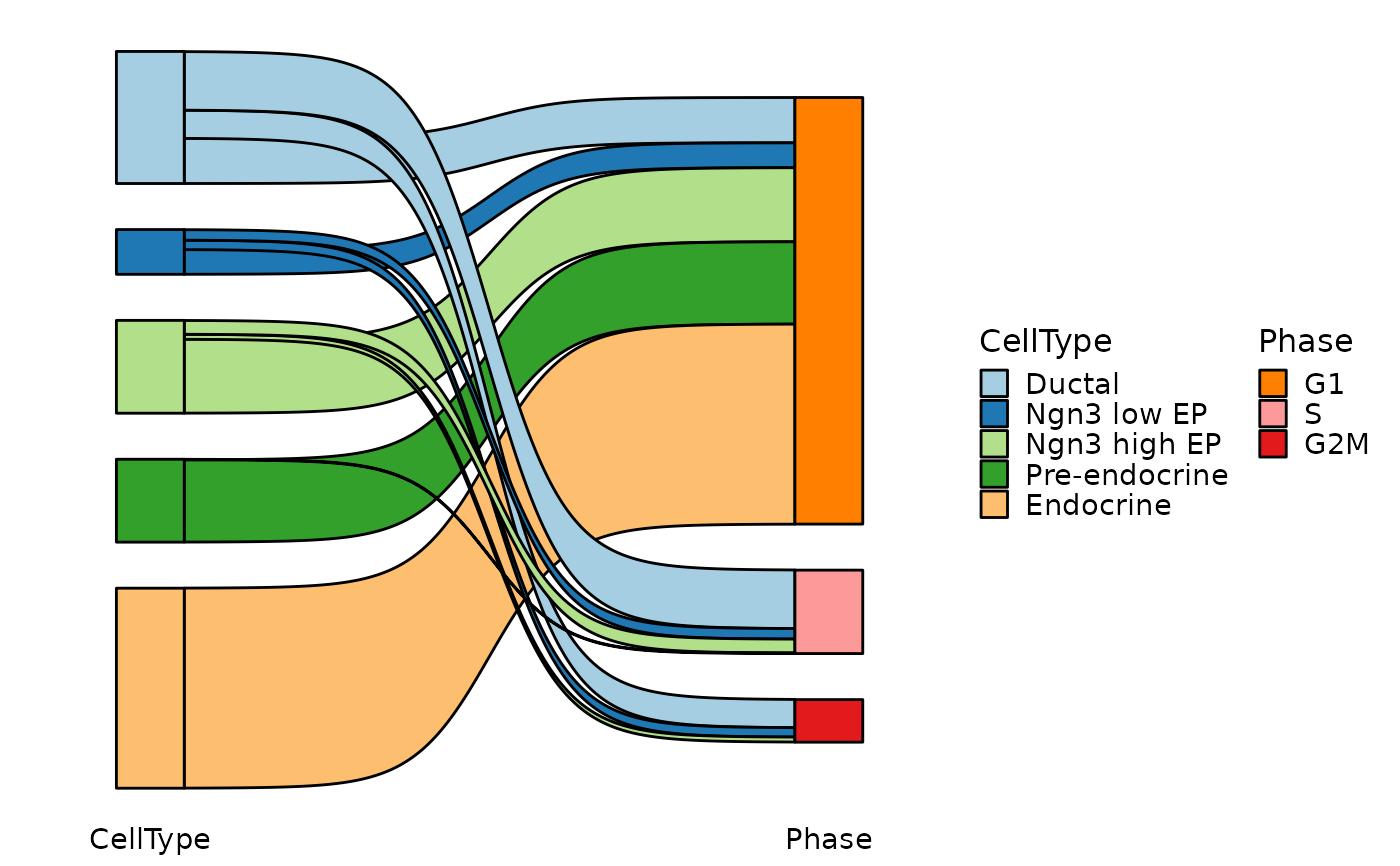
 CellStatPlot(pancreas_sub, stat.by = c("CellType", "Phase"), plot_type = "sankey")
#> Warning: stat_type is forcibly set to 'count' when plot sankey, chord, venn or upset
CellStatPlot(pancreas_sub, stat.by = c("CellType", "Phase"), plot_type = "sankey")
#> Warning: stat_type is forcibly set to 'count' when plot sankey, chord, venn or upset
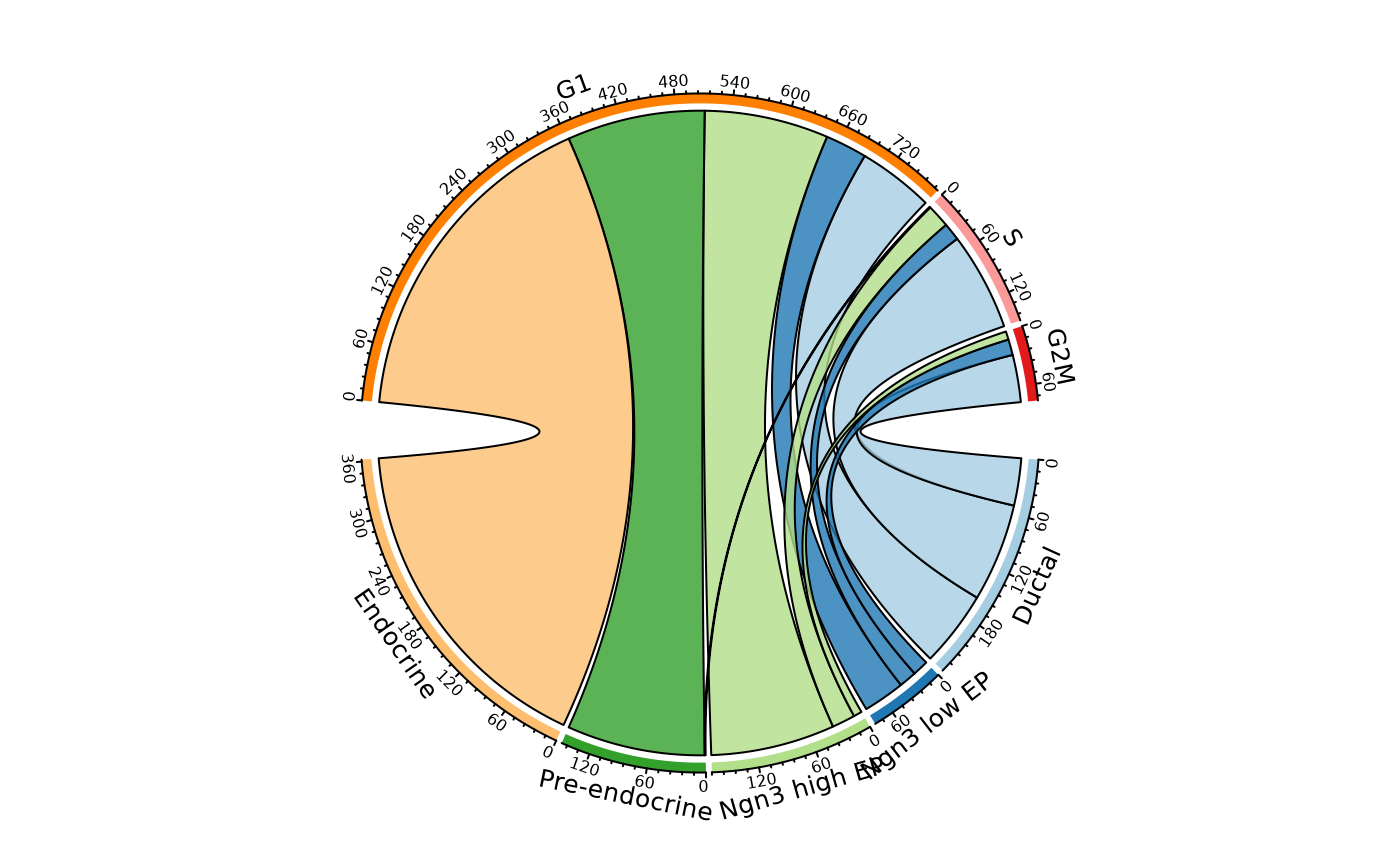
 CellStatPlot(pancreas_sub, stat.by = c("CellType", "Phase"), plot_type = "chord")
#> Warning: stat_type is forcibly set to 'count' when plot sankey, chord, venn or upset
CellStatPlot(pancreas_sub, stat.by = c("CellType", "Phase"), plot_type = "chord")
#> Warning: stat_type is forcibly set to 'count' when plot sankey, chord, venn or upset
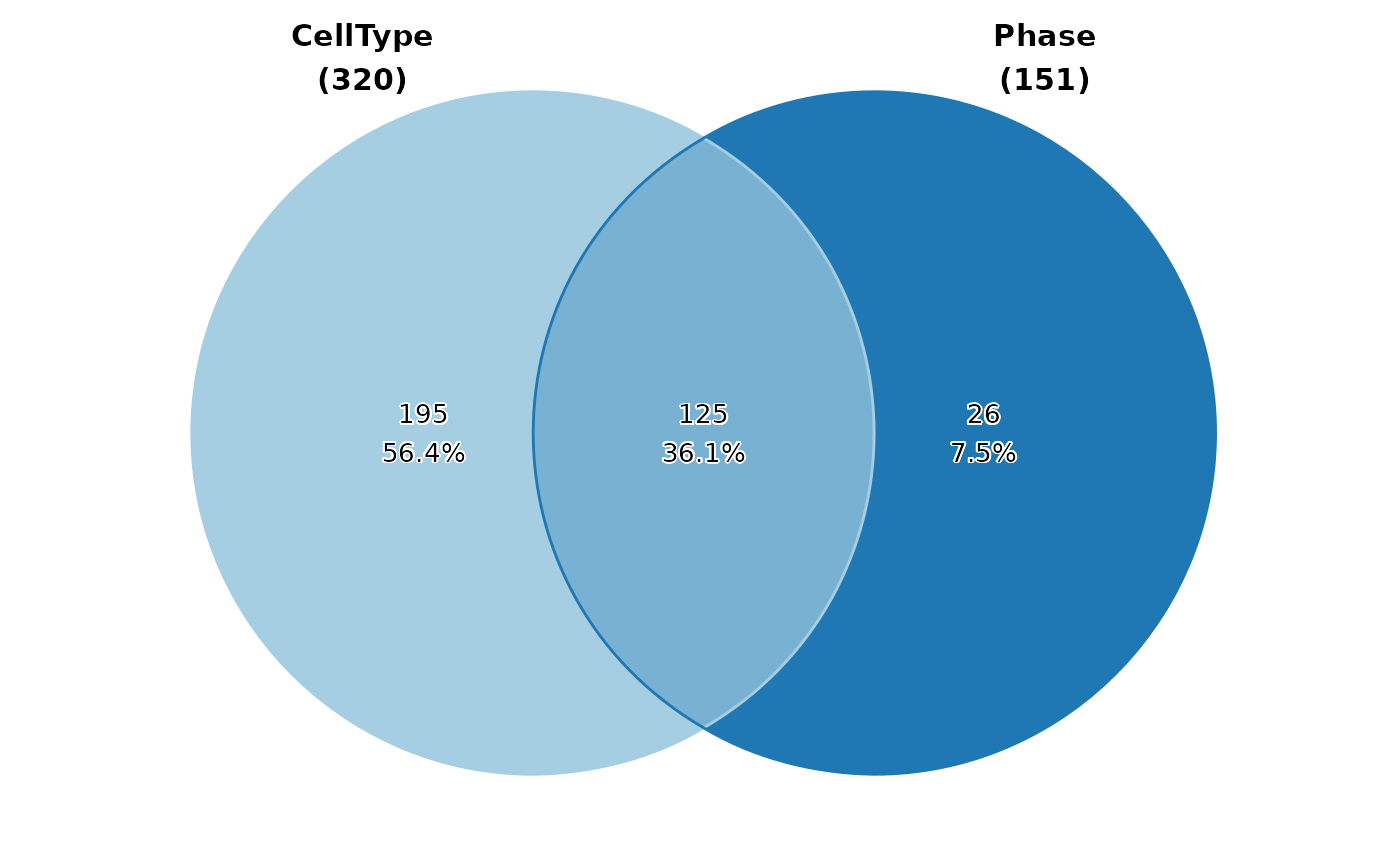
 CellStatPlot(pancreas_sub,
stat.by = c("CellType", "Phase"), plot_type = "venn",
stat_level = list(CellType = c("Ductal", "Ngn3 low EP"), Phase = "S")
)
#> Warning: stat_type is forcibly set to 'count' when plot sankey, chord, venn or upset
CellStatPlot(pancreas_sub,
stat.by = c("CellType", "Phase"), plot_type = "venn",
stat_level = list(CellType = c("Ductal", "Ngn3 low EP"), Phase = "S")
)
#> Warning: stat_type is forcibly set to 'count' when plot sankey, chord, venn or upset
 pancreas_sub$Progenitor <- pancreas_sub$CellType %in% c("Ngn3 low EP", "Ngn3 high EP")
pancreas_sub$G2M <- pancreas_sub$Phase == "G2M"
pancreas_sub$Sox9_Expressed <- pancreas_sub[["RNA"]]@counts["Sox9", ] > 0
pancreas_sub$Neurog3_Expressed <- pancreas_sub[["RNA"]]@counts["Neurog3", ] > 0
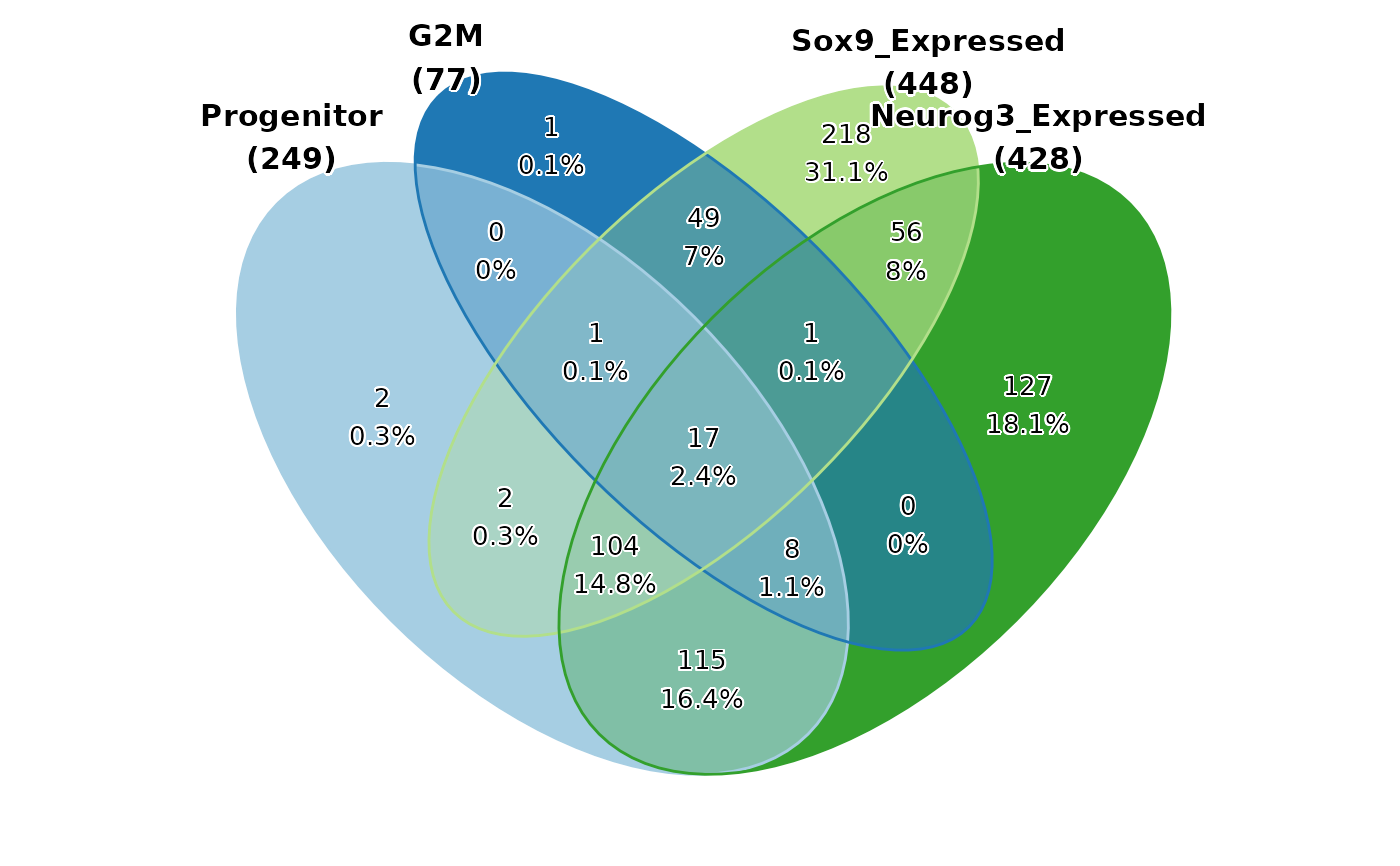
CellStatPlot(pancreas_sub, stat.by = c("Progenitor", "G2M", "Sox9_Expressed", "Neurog3_Expressed"), plot_type = "venn", stat_level = "TRUE")
#> Warning: stat_type is forcibly set to 'count' when plot sankey, chord, venn or upset
pancreas_sub$Progenitor <- pancreas_sub$CellType %in% c("Ngn3 low EP", "Ngn3 high EP")
pancreas_sub$G2M <- pancreas_sub$Phase == "G2M"
pancreas_sub$Sox9_Expressed <- pancreas_sub[["RNA"]]@counts["Sox9", ] > 0
pancreas_sub$Neurog3_Expressed <- pancreas_sub[["RNA"]]@counts["Neurog3", ] > 0
CellStatPlot(pancreas_sub, stat.by = c("Progenitor", "G2M", "Sox9_Expressed", "Neurog3_Expressed"), plot_type = "venn", stat_level = "TRUE")
#> Warning: stat_type is forcibly set to 'count' when plot sankey, chord, venn or upset
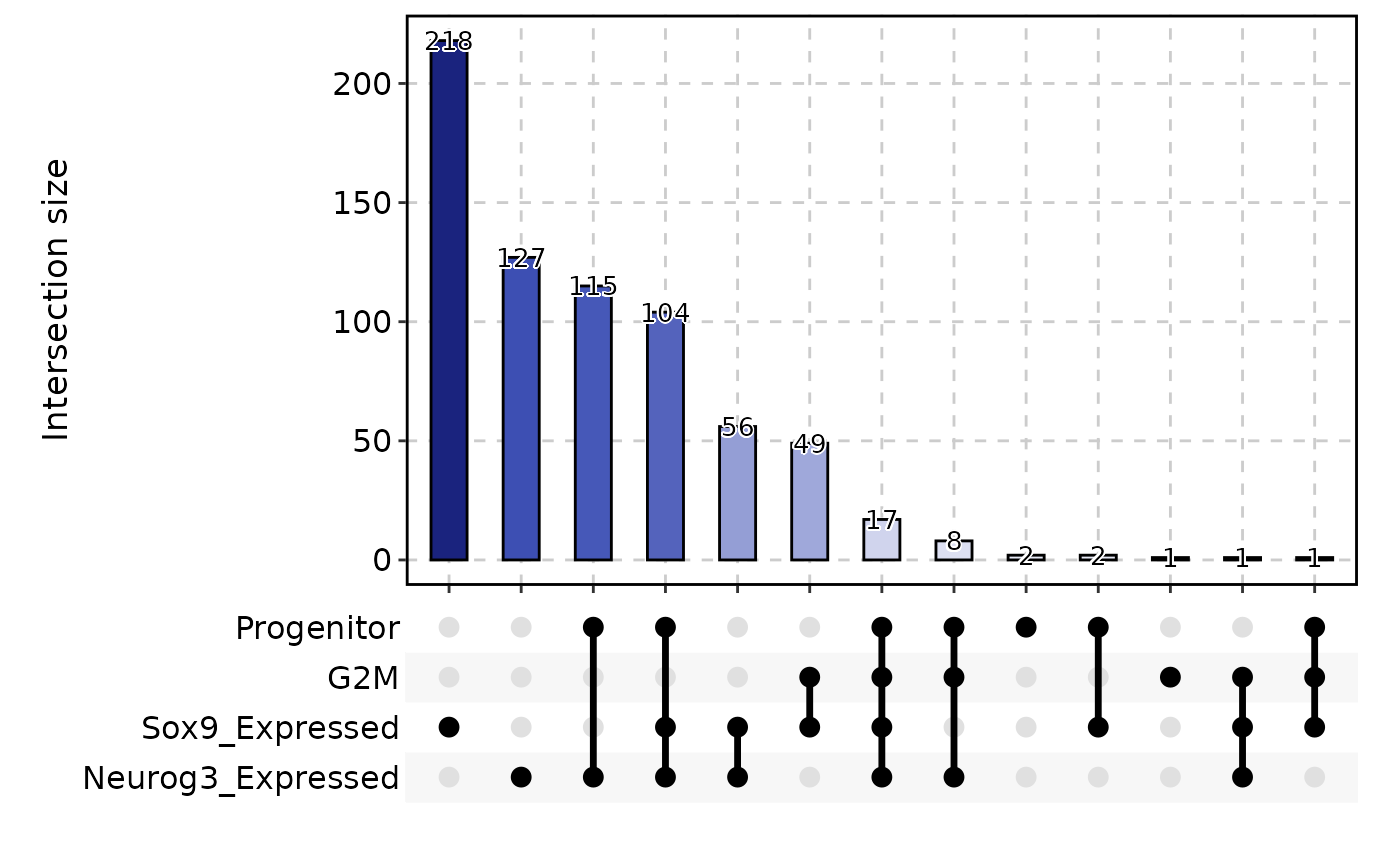
 CellStatPlot(pancreas_sub, stat.by = c("Progenitor", "G2M", "Sox9_Expressed", "Neurog3_Expressed"), plot_type = "upset", stat_level = "TRUE")
#> Warning: stat_type is forcibly set to 'count' when plot sankey, chord, venn or upset
CellStatPlot(pancreas_sub, stat.by = c("Progenitor", "G2M", "Sox9_Expressed", "Neurog3_Expressed"), plot_type = "upset", stat_level = "TRUE")
#> Warning: stat_type is forcibly set to 'count' when plot sankey, chord, venn or upset
 sum(pancreas_sub$Progenitor == "FALSE" &
pancreas_sub$G2M == "FALSE" &
pancreas_sub$Sox9_Expressed == "TRUE" &
pancreas_sub$Neurog3_Expressed == "FALSE")
#> [1] 218
sum(pancreas_sub$Progenitor == "FALSE" &
pancreas_sub$G2M == "FALSE" &
pancreas_sub$Sox9_Expressed == "TRUE" &
pancreas_sub$Neurog3_Expressed == "FALSE")
#> [1] 218