Statistical plot of cell classification
Usage
ClassStatPlot(
  srt,
  stat.by = "orig.ident",
  group.by = NULL,
  split.by = NULL,
  cells = NULL,
  flip = FALSE,
  NA_color = "grey",
  NA_stat = TRUE,
  keep_empty = FALSE,
  stat_single = FALSE,
  stat_level = NULL,
  plot_type = c("bar", "rose", "ring", "pie", "area", "sankey", "chord", "venn", "upset"),
  stat_type = c("percent", "count"),
  position = c("stack", "dodge"),
  width = 0.8,
  palette = "Paired",
  palcolor = NULL,
  alpha = 1,
  label = FALSE,
  label.size = 3.5,
  label.fg = "black",
  label.bg = "white",
  label.bg.r = 0.1,
  theme_use = "theme_scp",
  aspect.ratio = NULL,
  title = NULL,
  subtitle = NULL,
  xlab = NULL,
  ylab = NULL,
  legend.position = "right",
  legend.direction = "vertical",
  combine = TRUE,
  nrow = NULL,
  ncol = NULL,
  byrow = TRUE,
  align = "hv",
  axis = "lr",
  force = FALSE
)Examples
data("pancreas_sub")
ClassStatPlot(pancreas_sub, stat.by = "Phase", group.by = "CellType")
 ClassStatPlot(pancreas_sub, stat.by = "Phase", group.by = "CellType", stat_type = "count", position = "dodge", label = TRUE)
 ClassStatPlot(pancreas_sub, stat.by = "Phase", plot_type = "rose", label = TRUE)
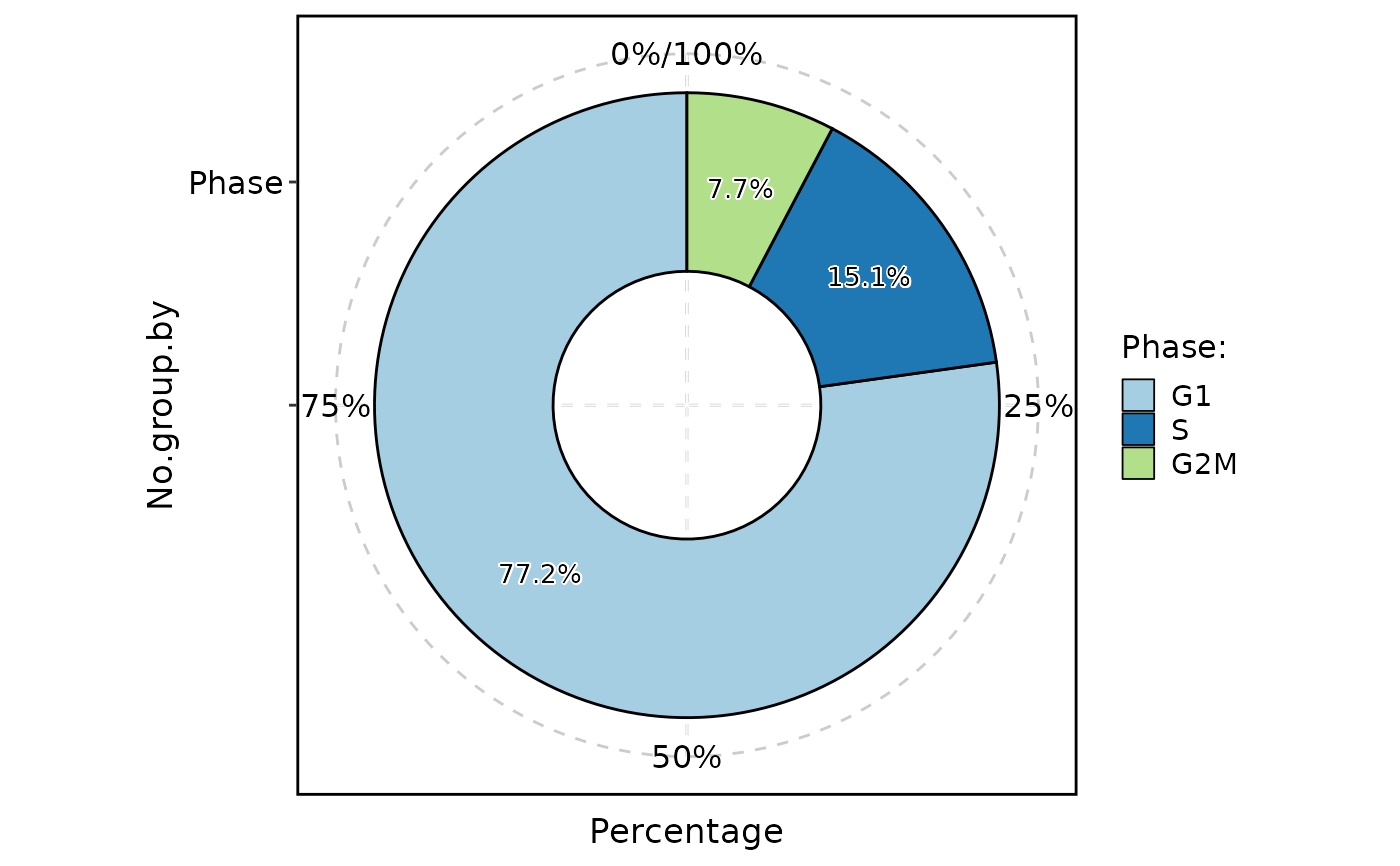
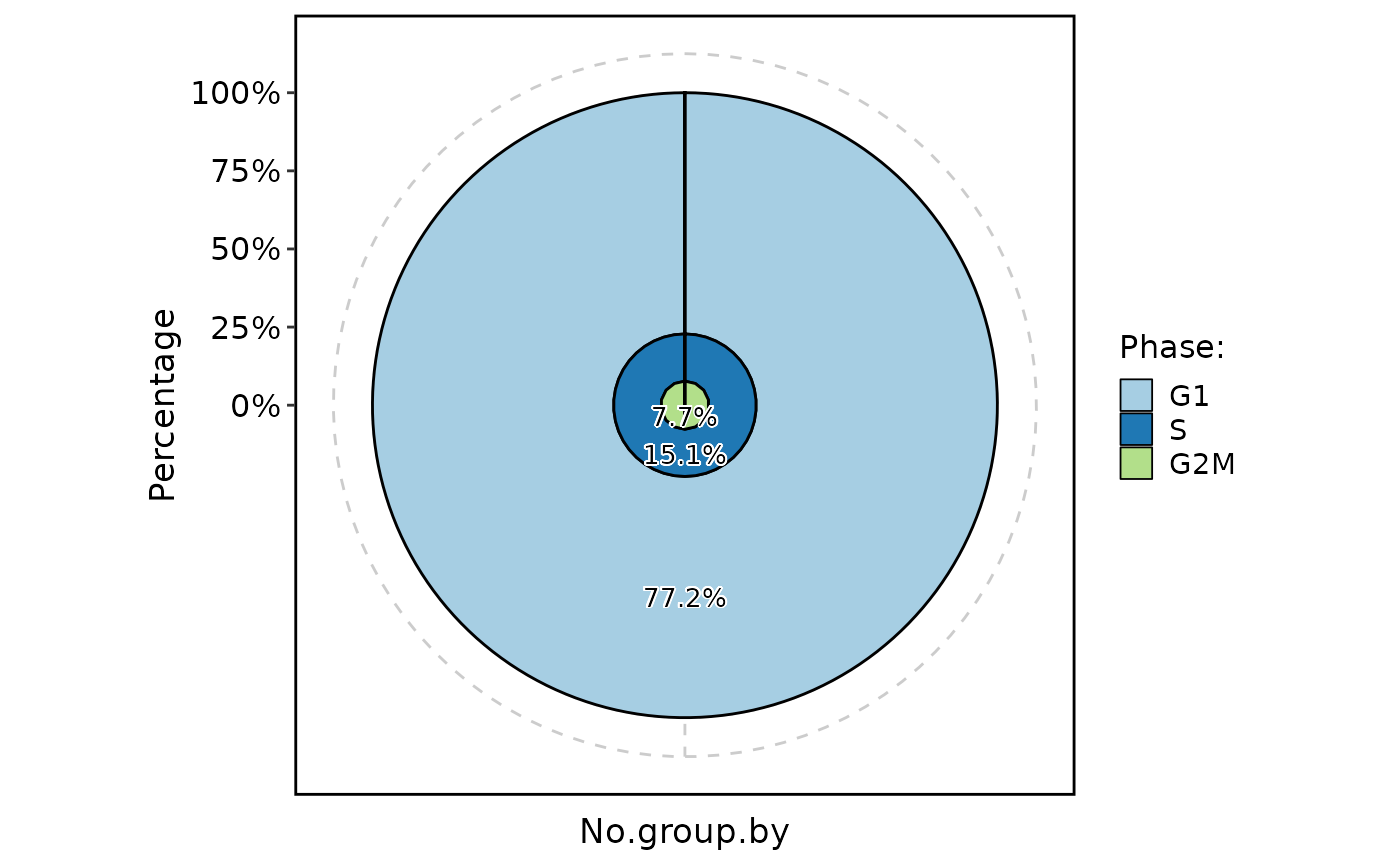 ClassStatPlot(pancreas_sub, stat.by = "Phase", plot_type = "ring", label = TRUE)
#> Warning: Removed 1 rows containing missing values (`position_stack()`).
#> Warning: Removed 1 rows containing missing values (`position_stack()`).
ClassStatPlot(pancreas_sub, stat.by = "Phase", plot_type = "ring", label = TRUE)
#> Warning: Removed 1 rows containing missing values (`position_stack()`).
#> Warning: Removed 1 rows containing missing values (`position_stack()`).
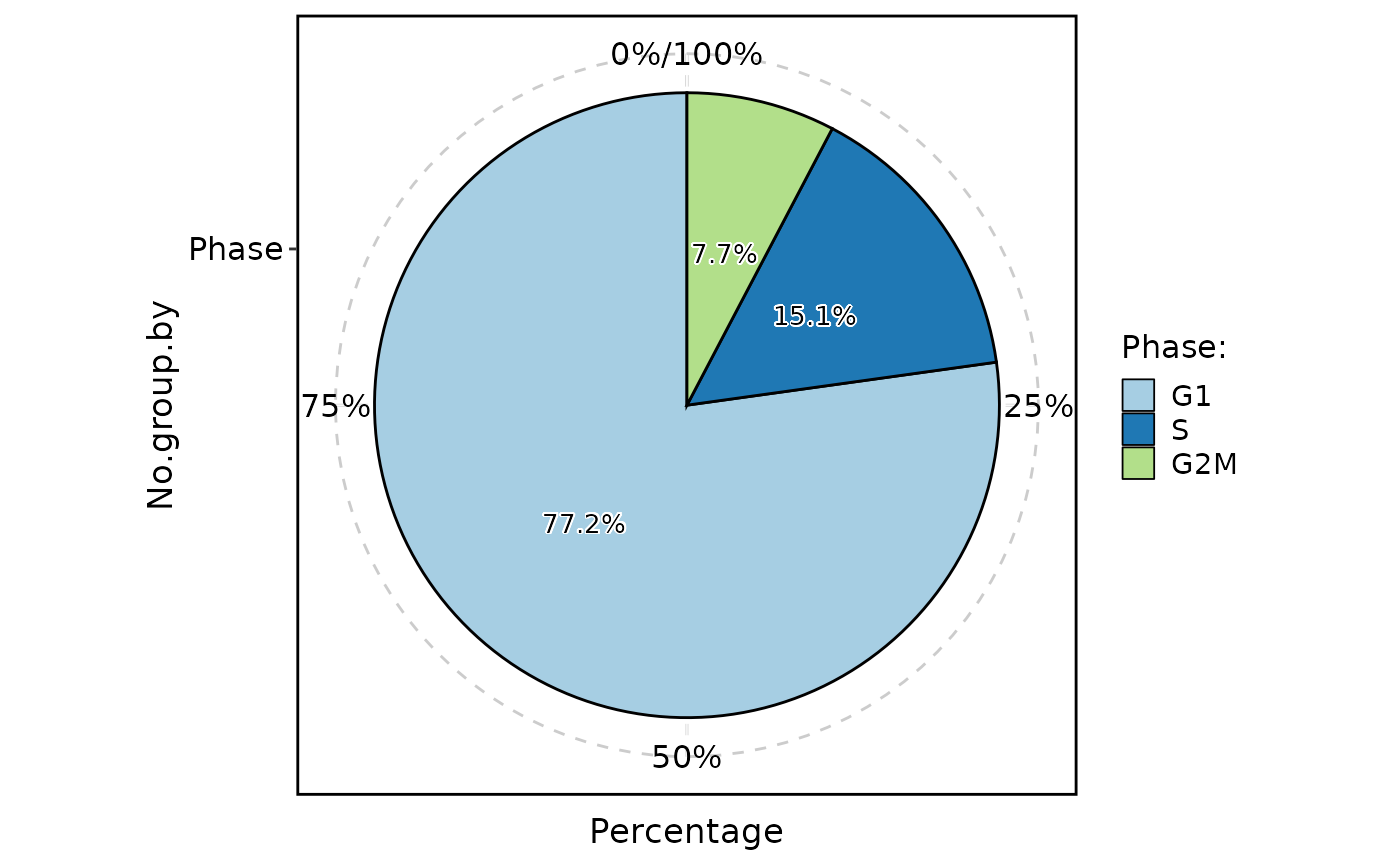
 ClassStatPlot(pancreas_sub, stat.by = "Phase", plot_type = "pie", label = TRUE)
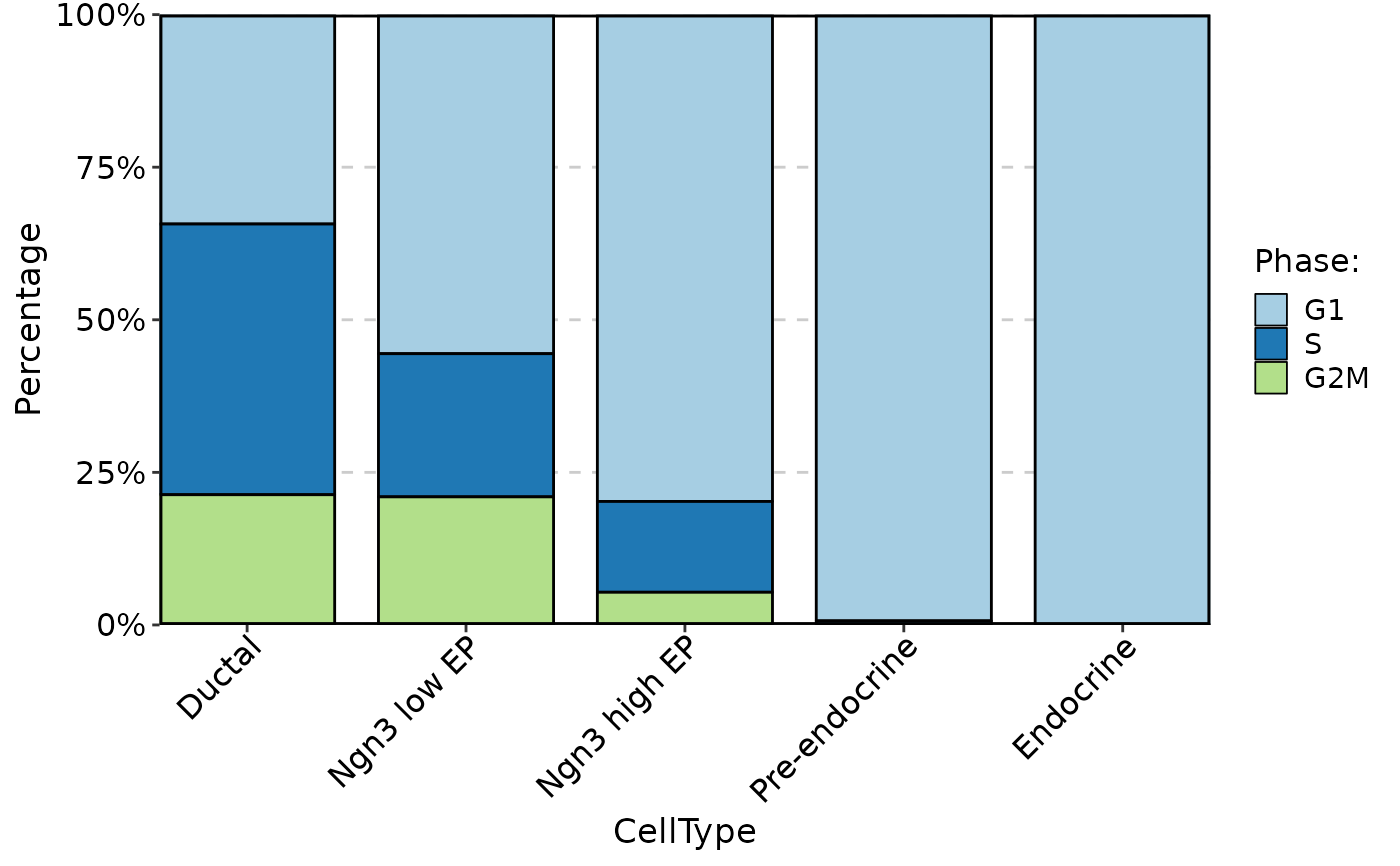
 ClassStatPlot(pancreas_sub, stat.by = "Phase", group.by = "CellType", plot_type = "bar", label = TRUE)
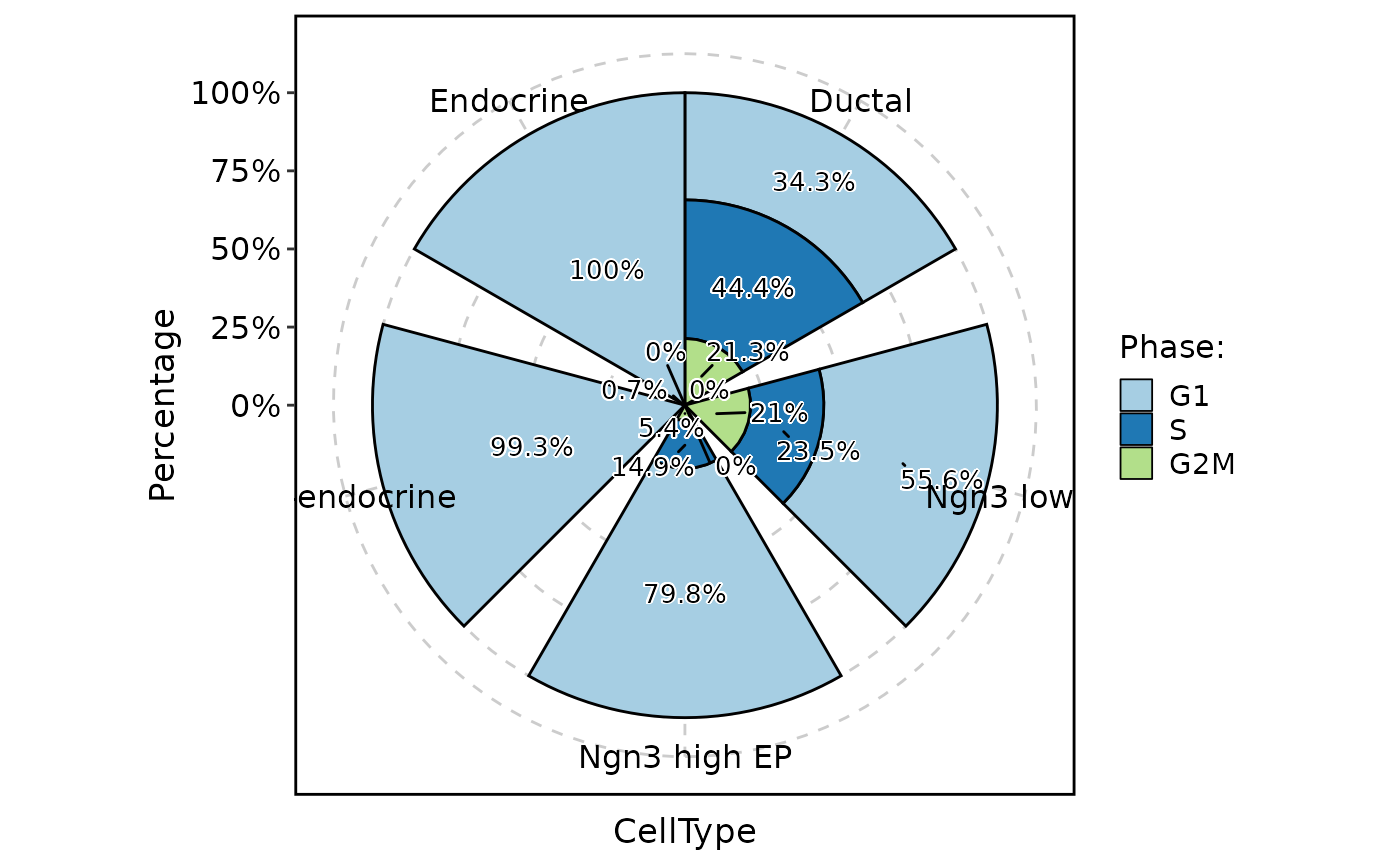
 ClassStatPlot(pancreas_sub, stat.by = "Phase", group.by = "CellType", plot_type = "rose", label = TRUE)
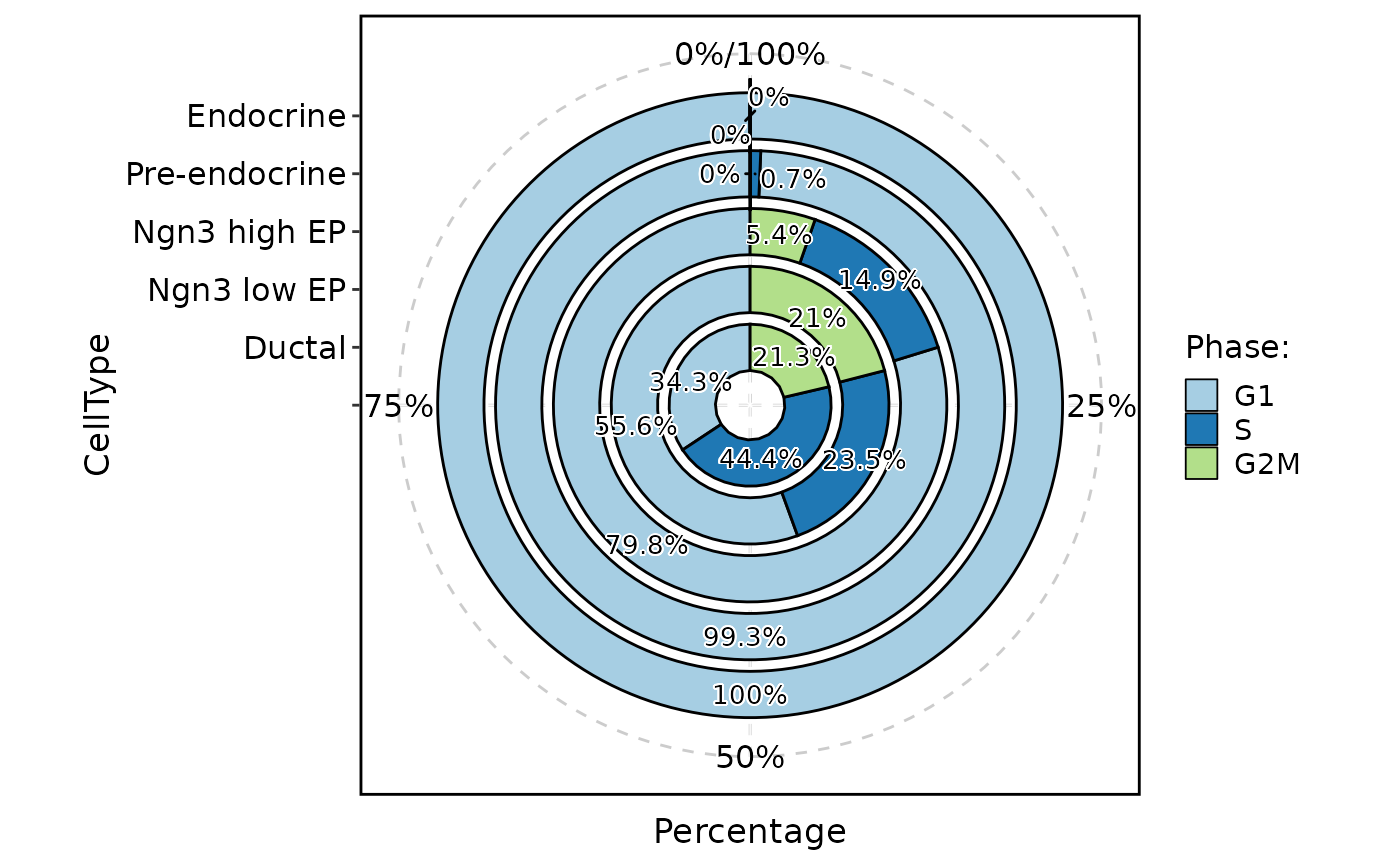
 ClassStatPlot(pancreas_sub, stat.by = "Phase", group.by = "CellType", plot_type = "ring", label = TRUE)
#> Warning: Removed 1 rows containing missing values (`position_stack()`).
#> Warning: Removed 1 rows containing missing values (`position_stack()`).
ClassStatPlot(pancreas_sub, stat.by = "Phase", group.by = "CellType", plot_type = "ring", label = TRUE)
#> Warning: Removed 1 rows containing missing values (`position_stack()`).
#> Warning: Removed 1 rows containing missing values (`position_stack()`).
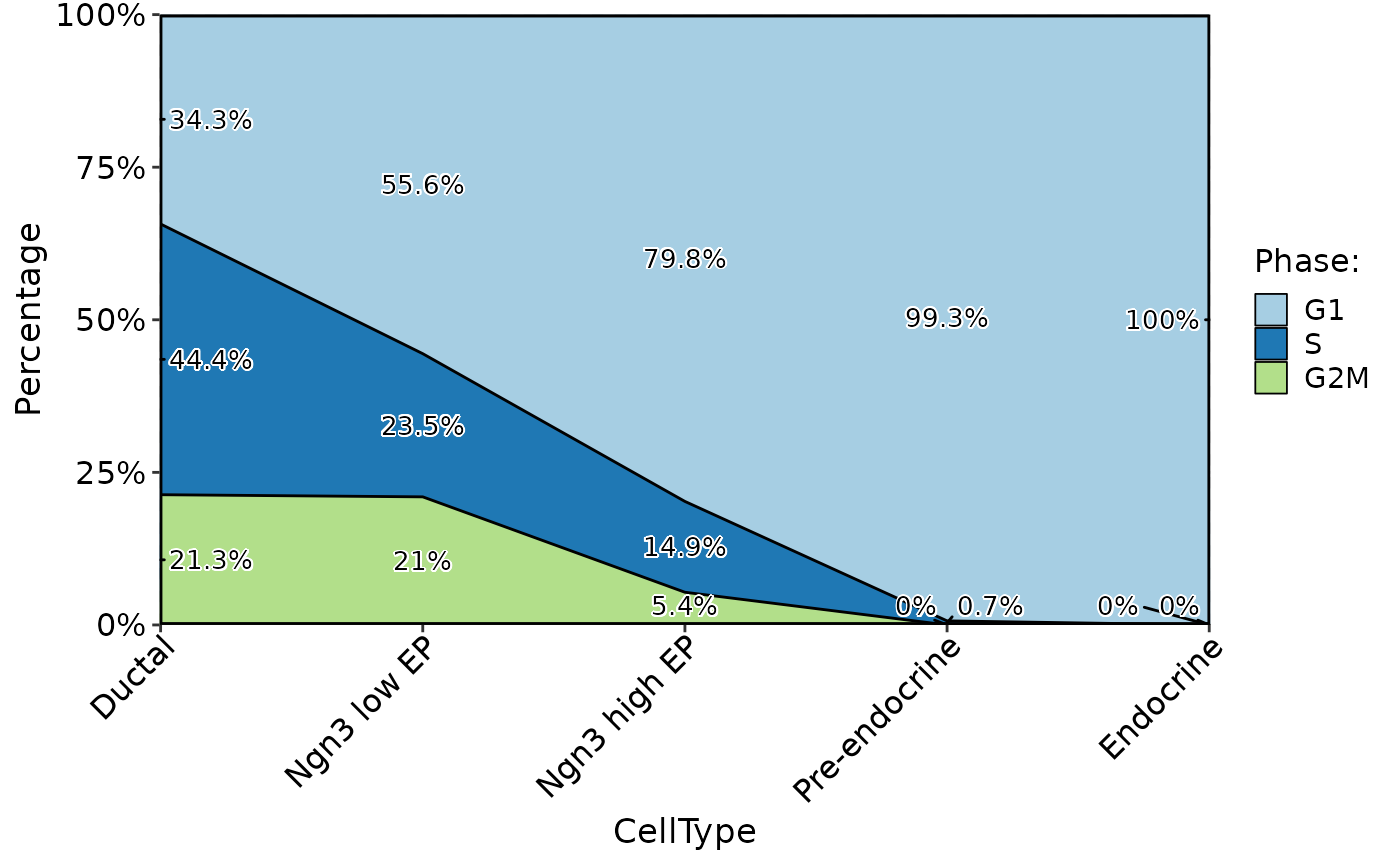
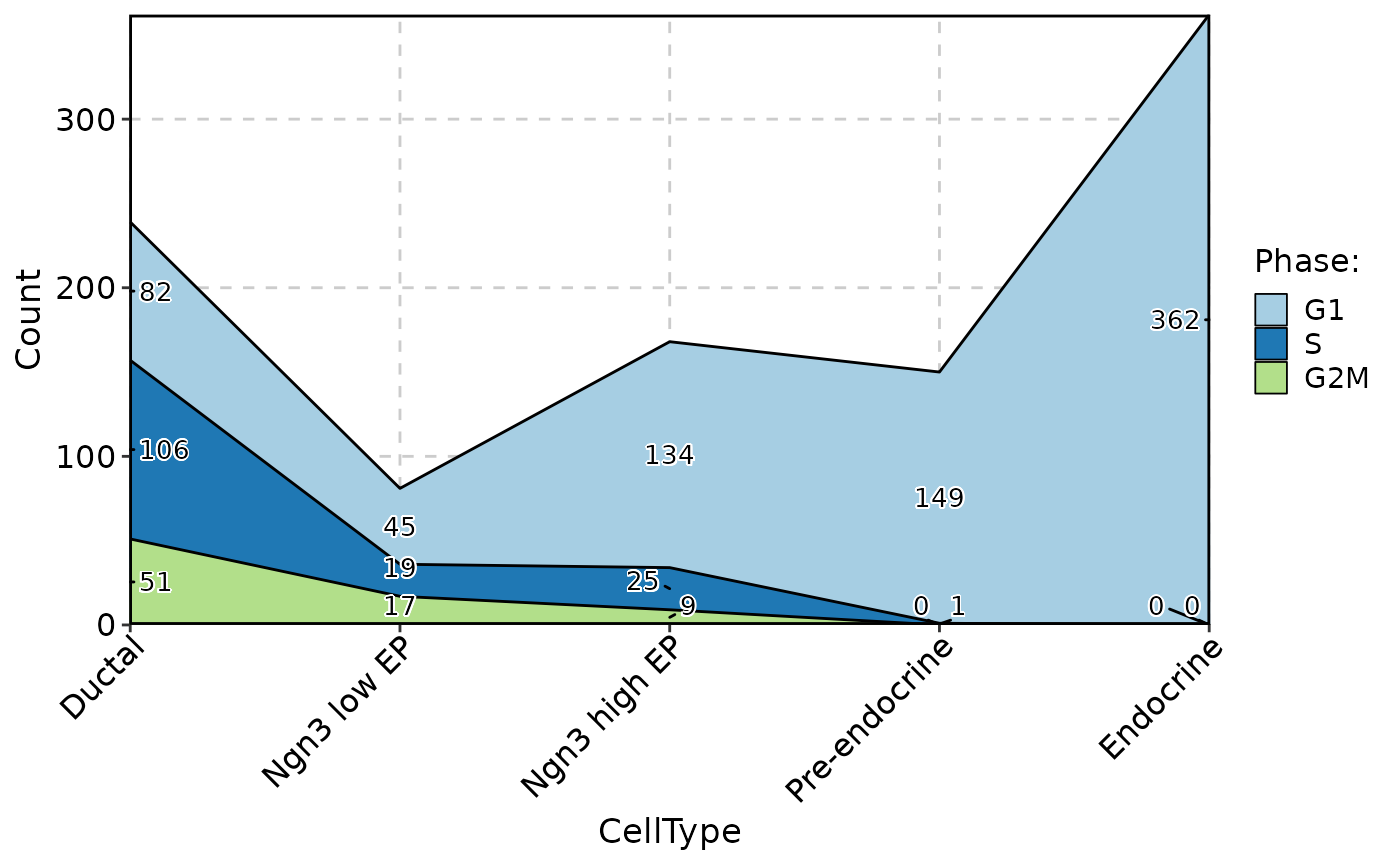
 ClassStatPlot(pancreas_sub, stat.by = "Phase", group.by = "CellType", plot_type = "area", label = TRUE)
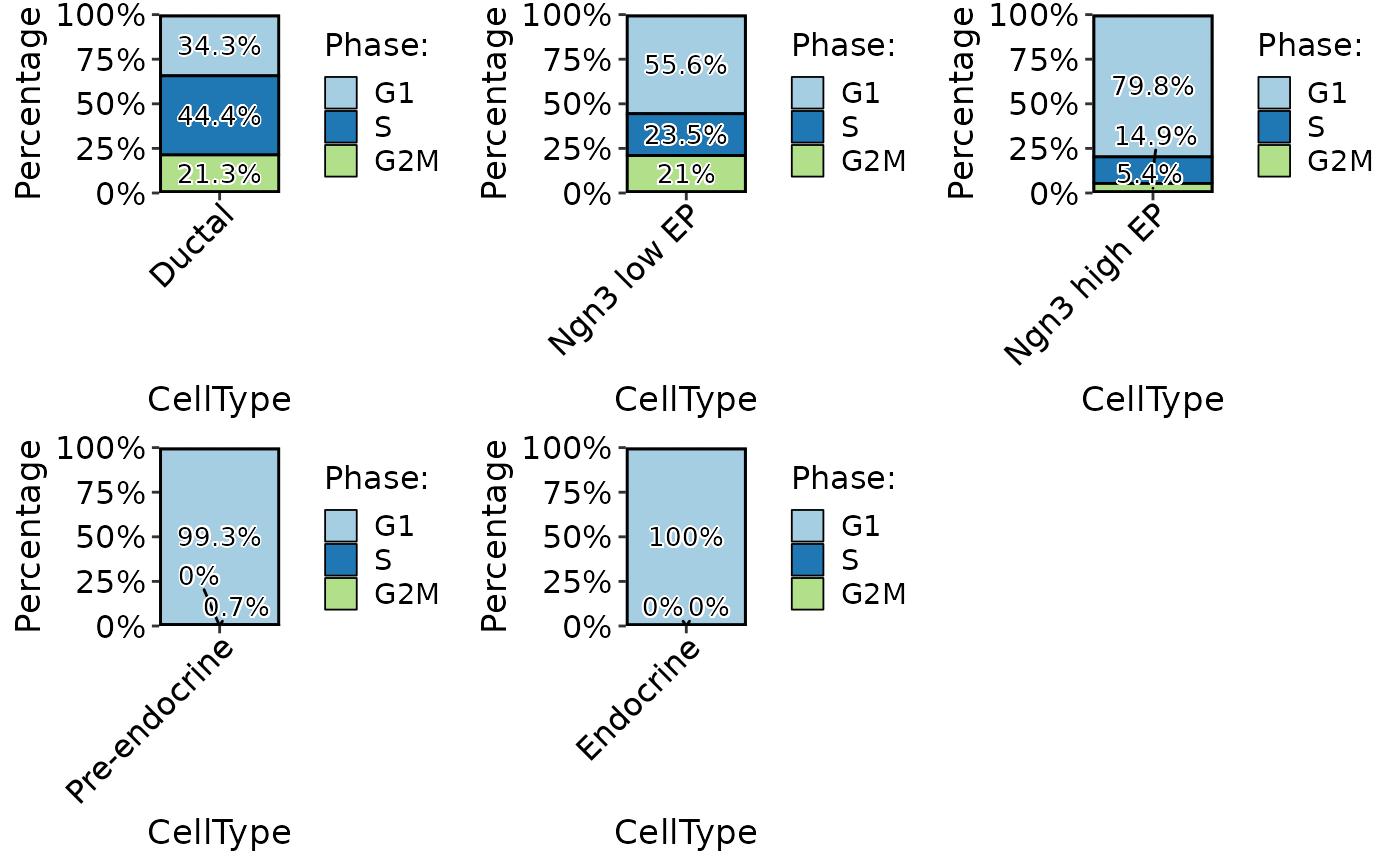
 ClassStatPlot(pancreas_sub, stat.by = "Phase", group.by = "CellType", plot_type = "bar", label = TRUE, stat_single = TRUE)
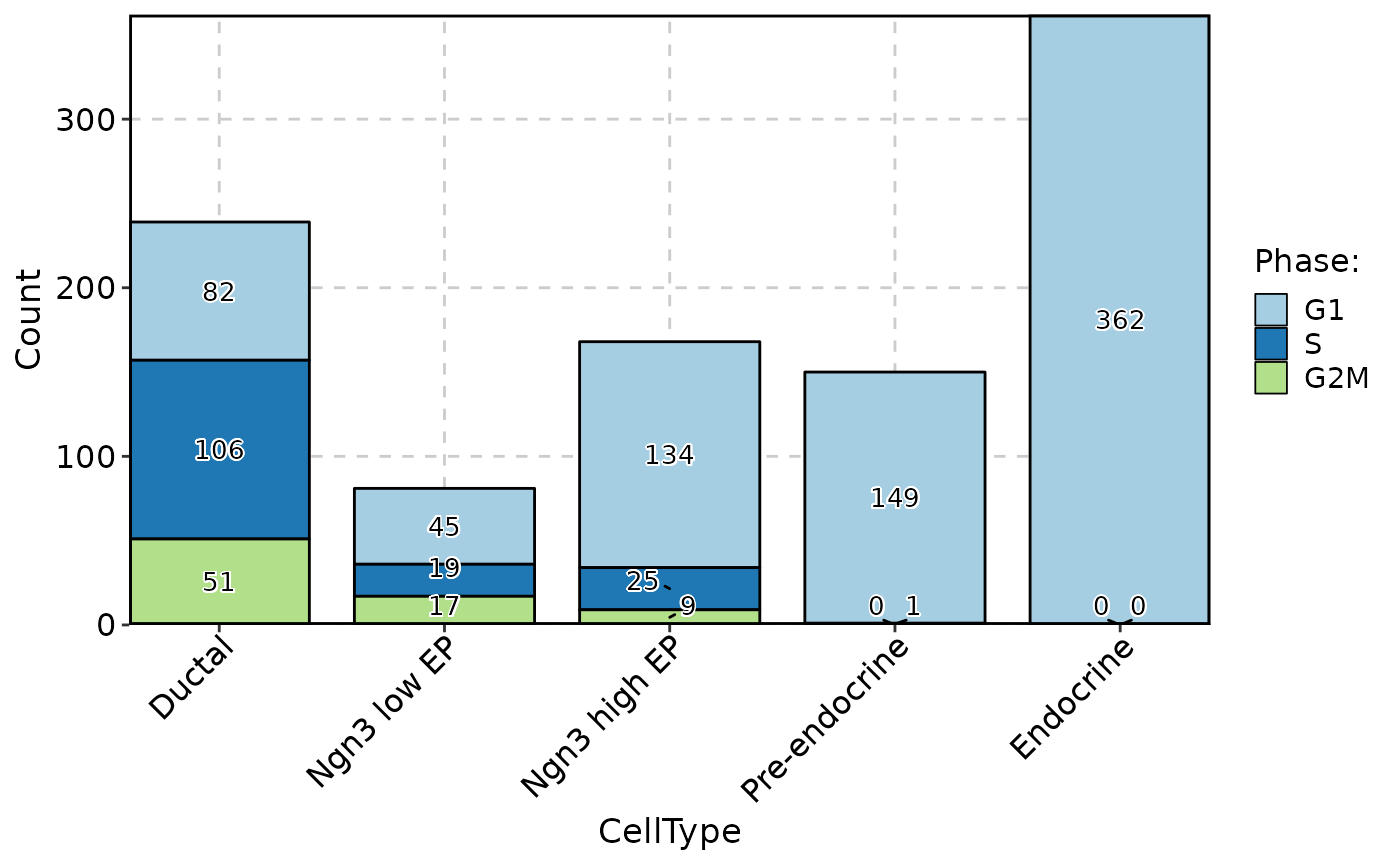
 ClassStatPlot(pancreas_sub, stat.by = "Phase", group.by = "CellType", stat_type = "count", plot_type = "bar", label = TRUE)
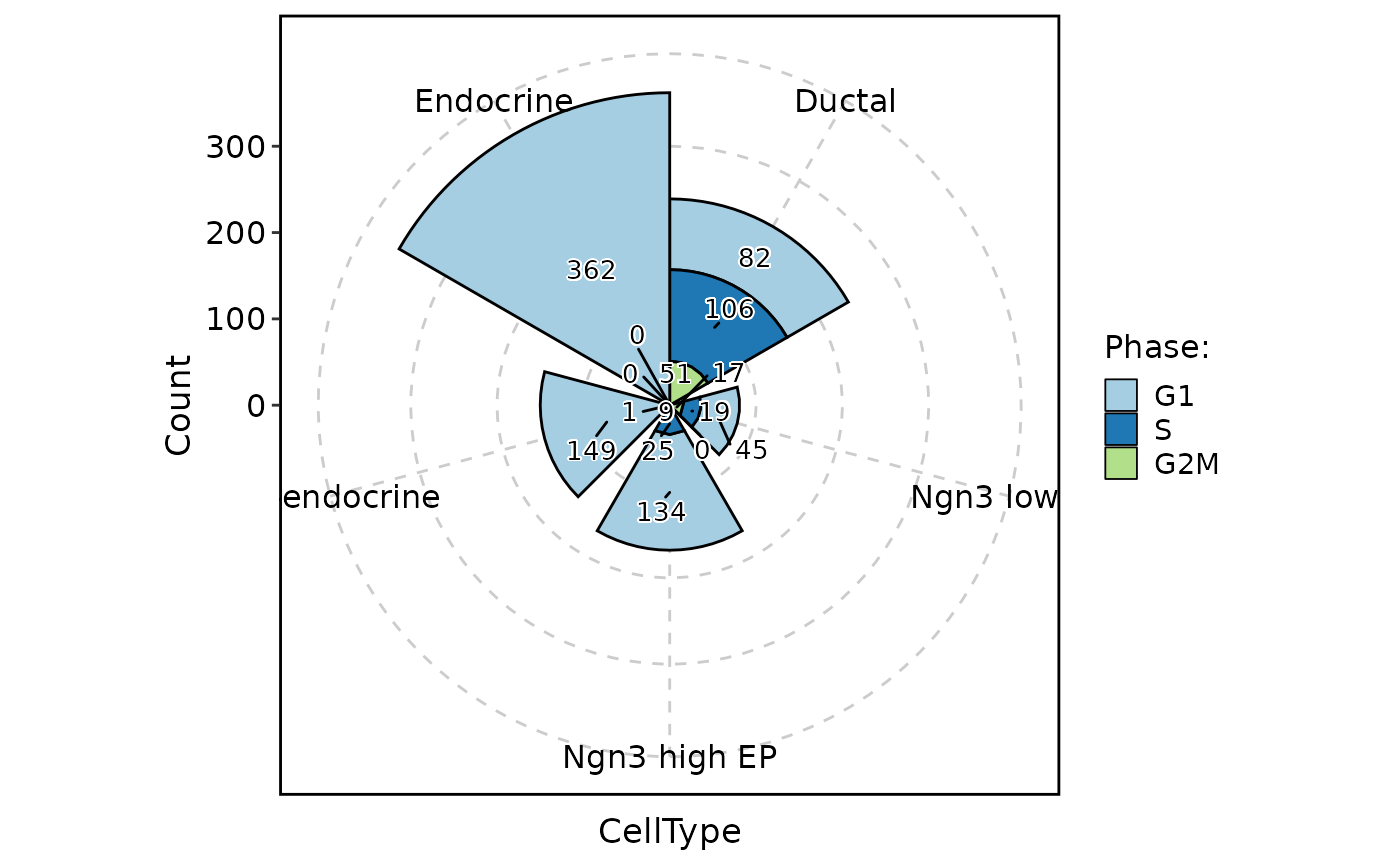
 ClassStatPlot(pancreas_sub, stat.by = "Phase", group.by = "CellType", stat_type = "count", plot_type = "rose", label = TRUE)
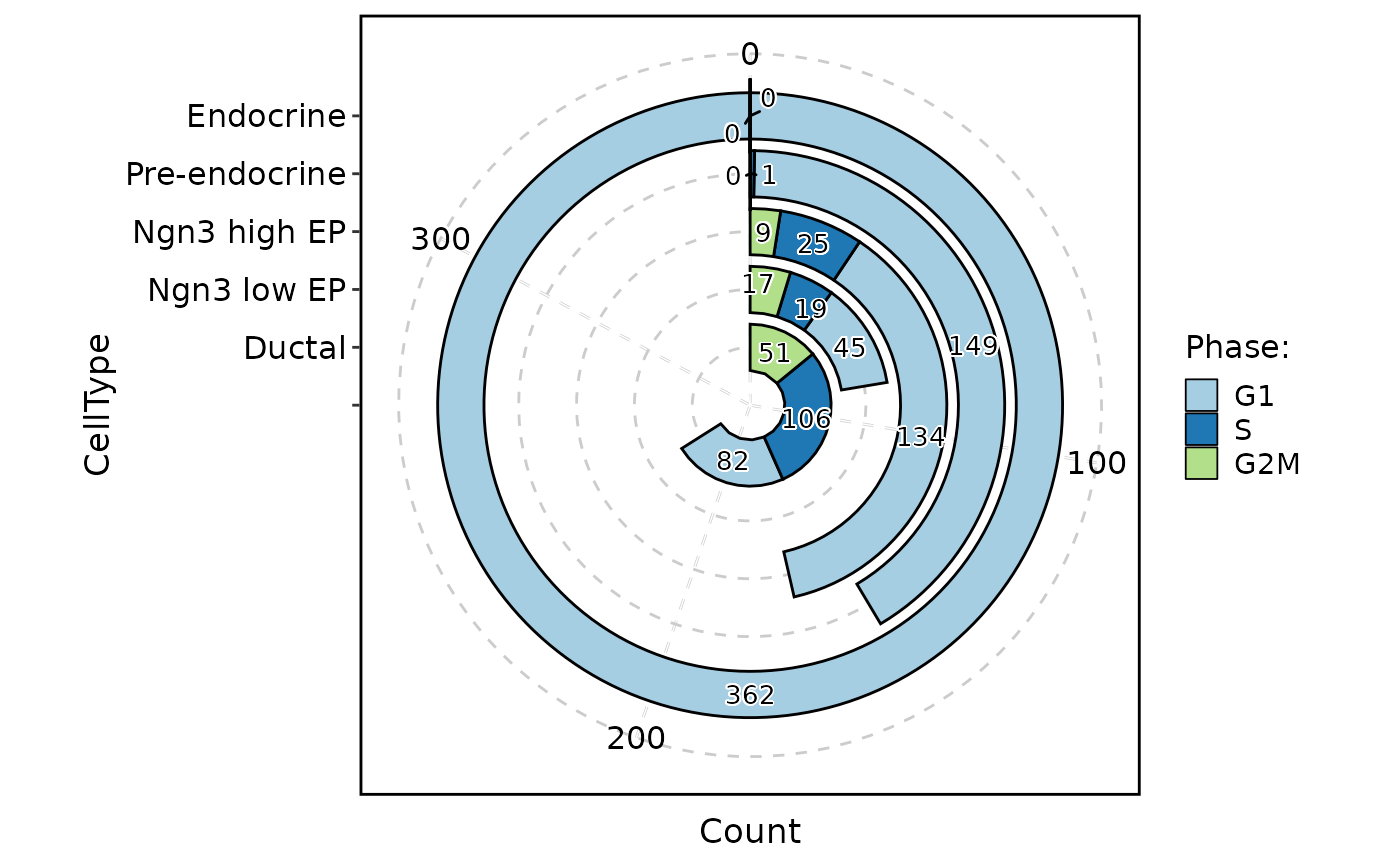
 ClassStatPlot(pancreas_sub, stat.by = "Phase", group.by = "CellType", stat_type = "count", plot_type = "ring", label = TRUE)
#> Warning: Removed 1 rows containing missing values (`position_stack()`).
#> Warning: Removed 1 rows containing missing values (`position_stack()`).
ClassStatPlot(pancreas_sub, stat.by = "Phase", group.by = "CellType", stat_type = "count", plot_type = "ring", label = TRUE)
#> Warning: Removed 1 rows containing missing values (`position_stack()`).
#> Warning: Removed 1 rows containing missing values (`position_stack()`).
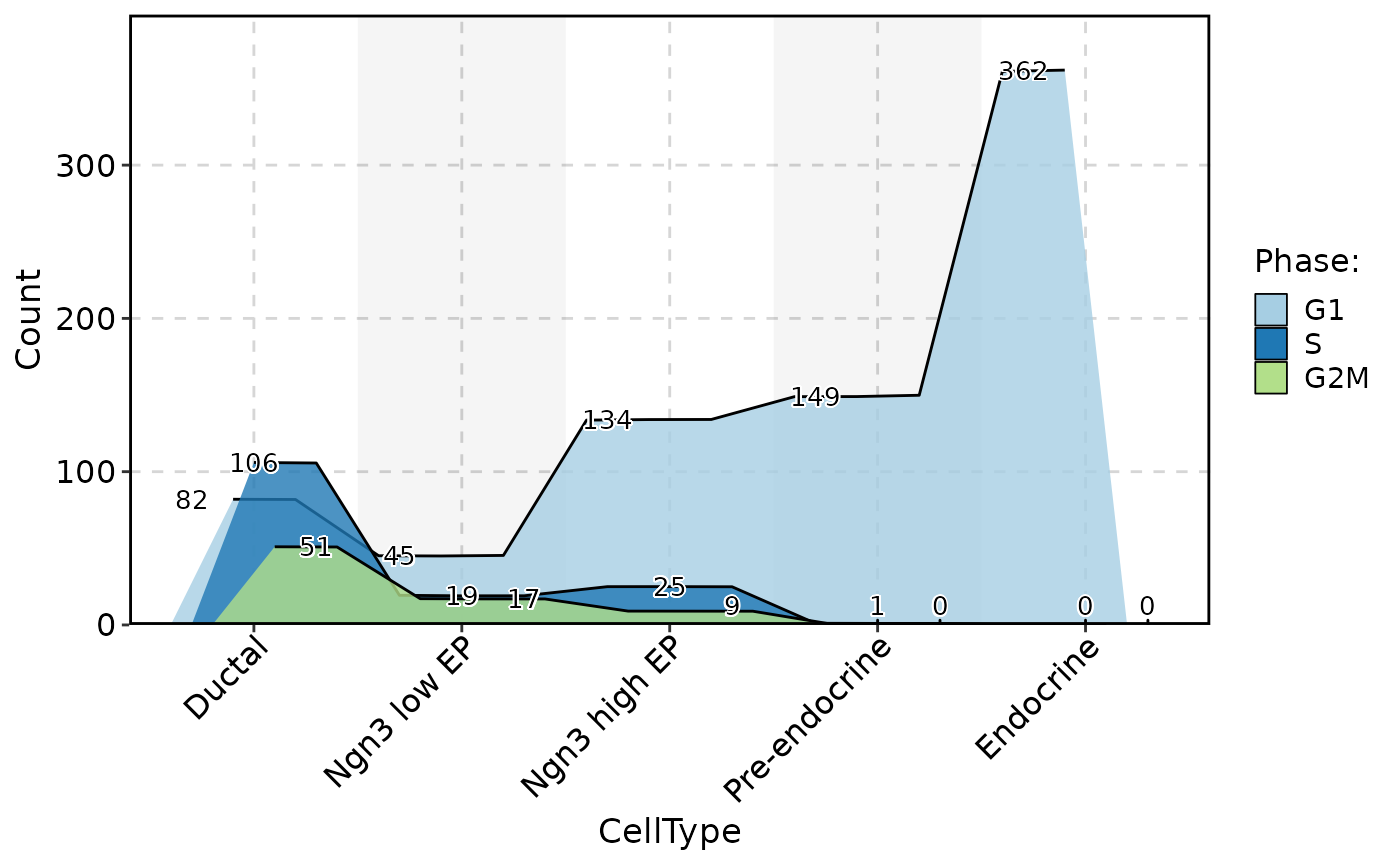
 ClassStatPlot(pancreas_sub, stat.by = "Phase", group.by = "CellType", stat_type = "count", plot_type = "area", label = TRUE)
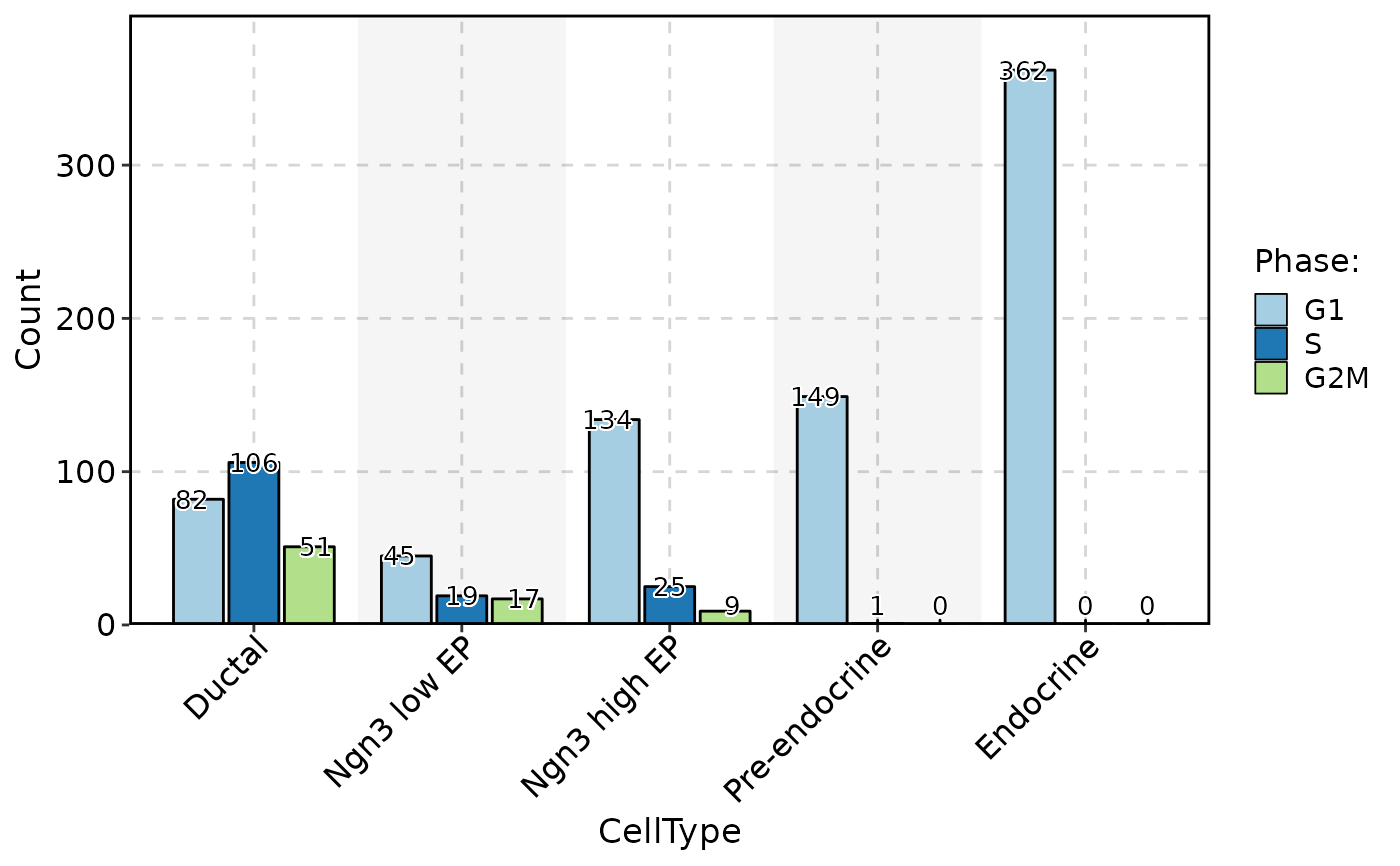
 ClassStatPlot(pancreas_sub, stat.by = "Phase", group.by = "CellType", stat_type = "count", plot_type = "bar", position = "dodge", label = TRUE)
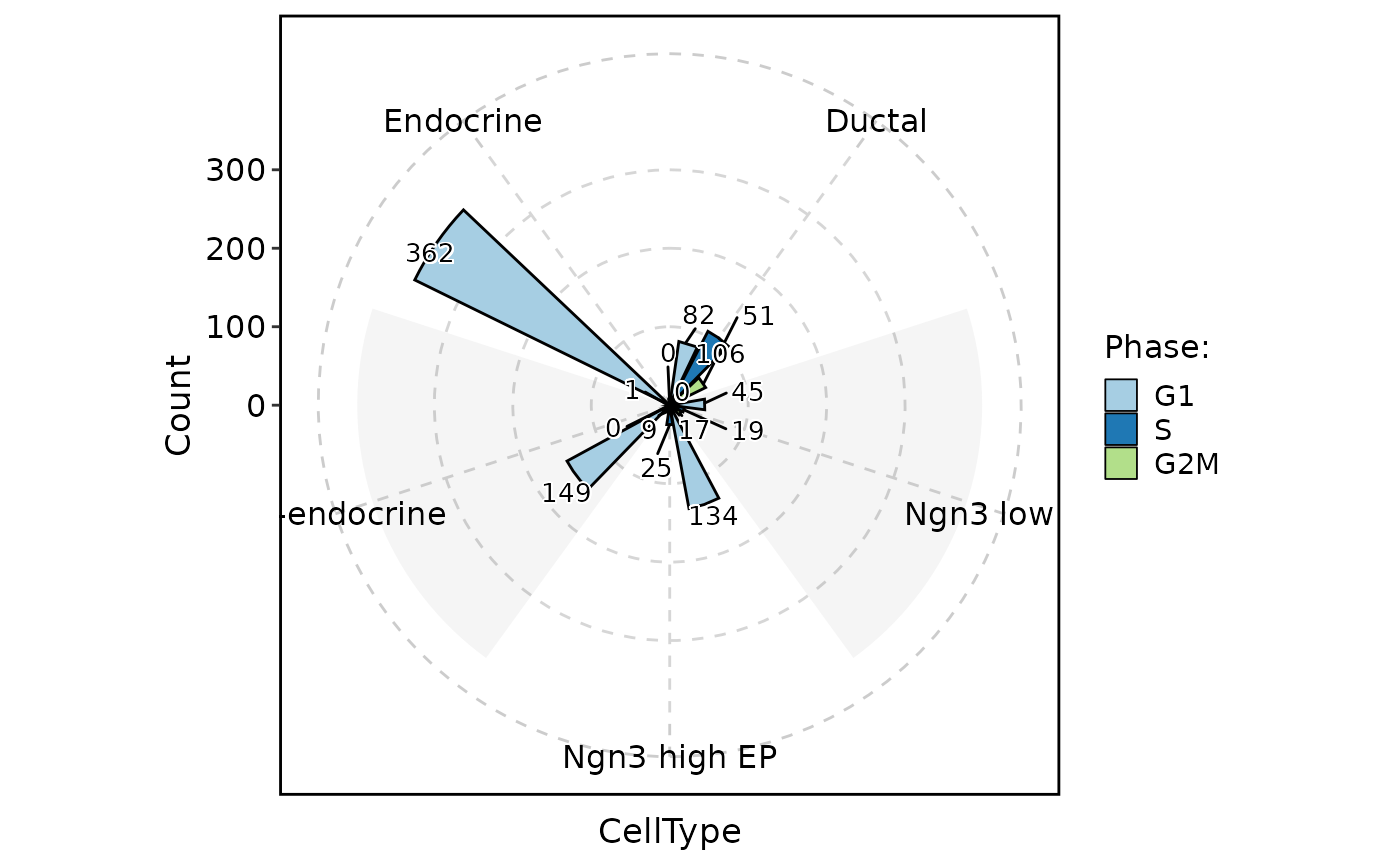
 ClassStatPlot(pancreas_sub, stat.by = "Phase", group.by = "CellType", stat_type = "count", plot_type = "rose", position = "dodge", label = TRUE)
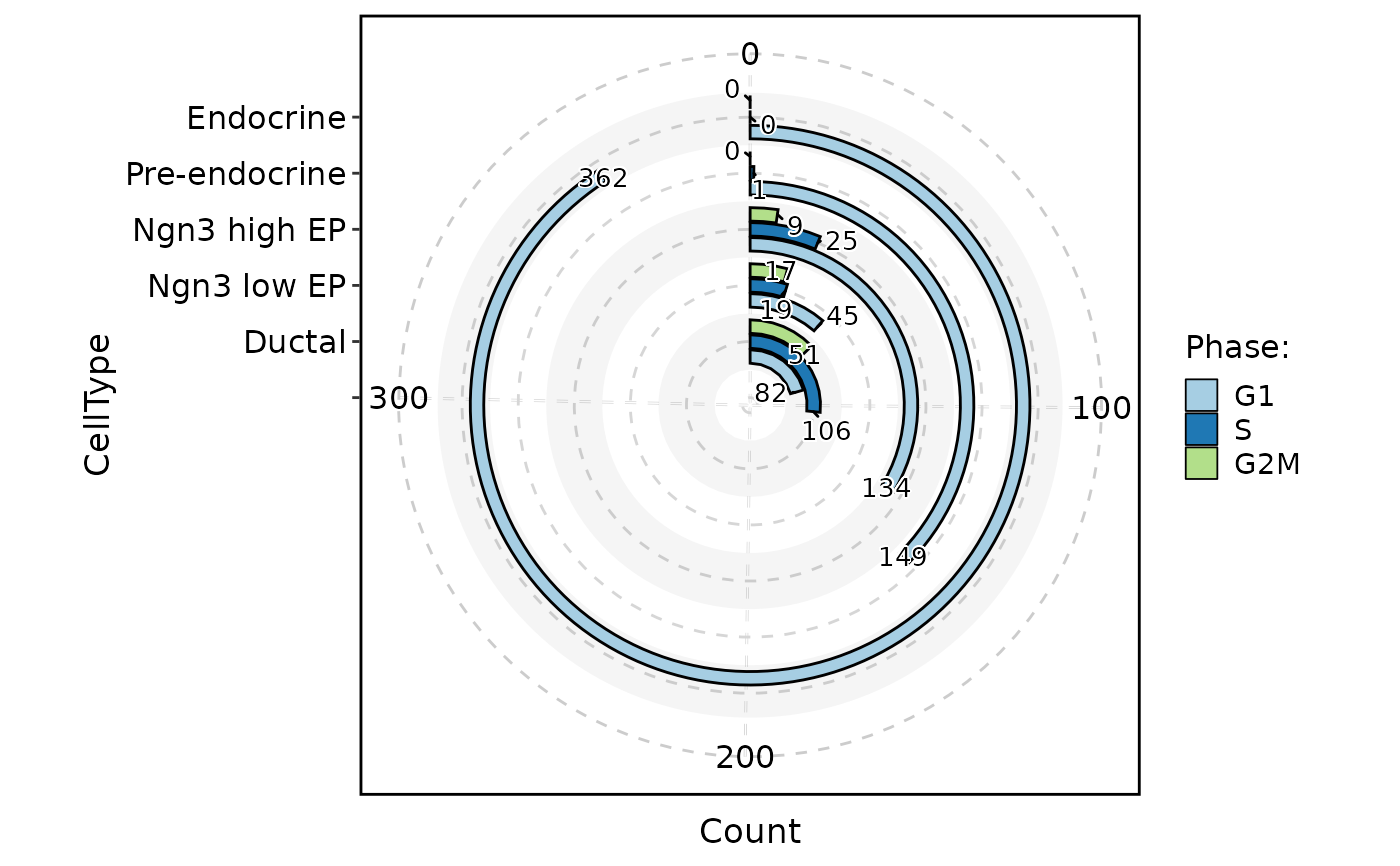
 ClassStatPlot(pancreas_sub, stat.by = "Phase", group.by = "CellType", stat_type = "count", plot_type = "ring", position = "dodge", label = TRUE)
#> Warning: Removed 1 rows containing missing values (`geom_col()`).
#> Warning: Removed 1 rows containing missing values (`geom_text_repel()`).
ClassStatPlot(pancreas_sub, stat.by = "Phase", group.by = "CellType", stat_type = "count", plot_type = "ring", position = "dodge", label = TRUE)
#> Warning: Removed 1 rows containing missing values (`geom_col()`).
#> Warning: Removed 1 rows containing missing values (`geom_text_repel()`).
 ClassStatPlot(pancreas_sub, stat.by = "Phase", group.by = "CellType", stat_type = "count", plot_type = "area", position = "dodge", label = TRUE, alpha = 0.8)
 # ClassStatPlot(pancreas_sub, stat.by = c("CellType", "Phase"), plot_type = "sankey")
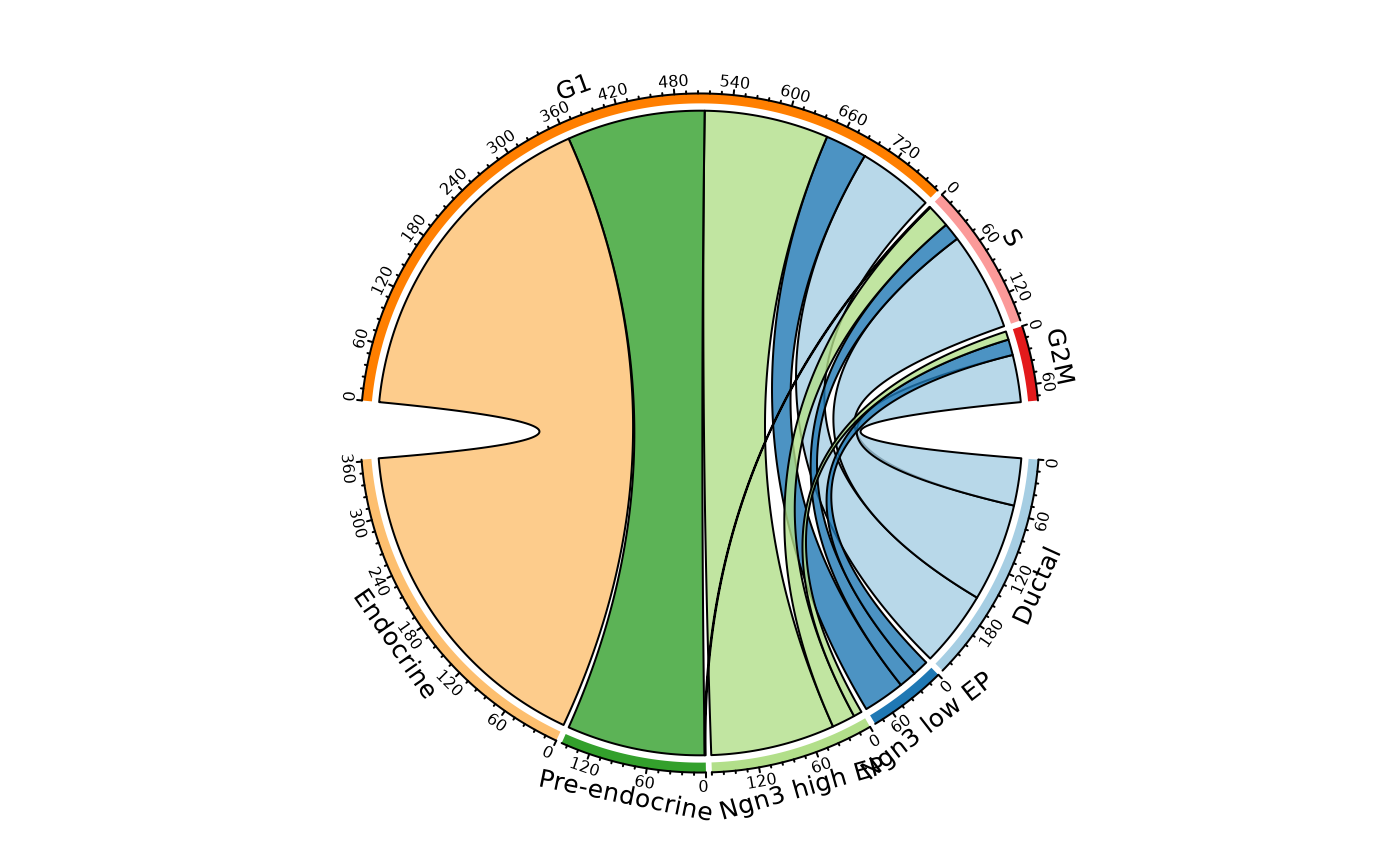
ClassStatPlot(pancreas_sub, stat.by = c("CellType", "Phase"), plot_type = "chord")
# ClassStatPlot(pancreas_sub, stat.by = c("CellType", "Phase"), plot_type = "sankey")
ClassStatPlot(pancreas_sub, stat.by = c("CellType", "Phase"), plot_type = "chord")
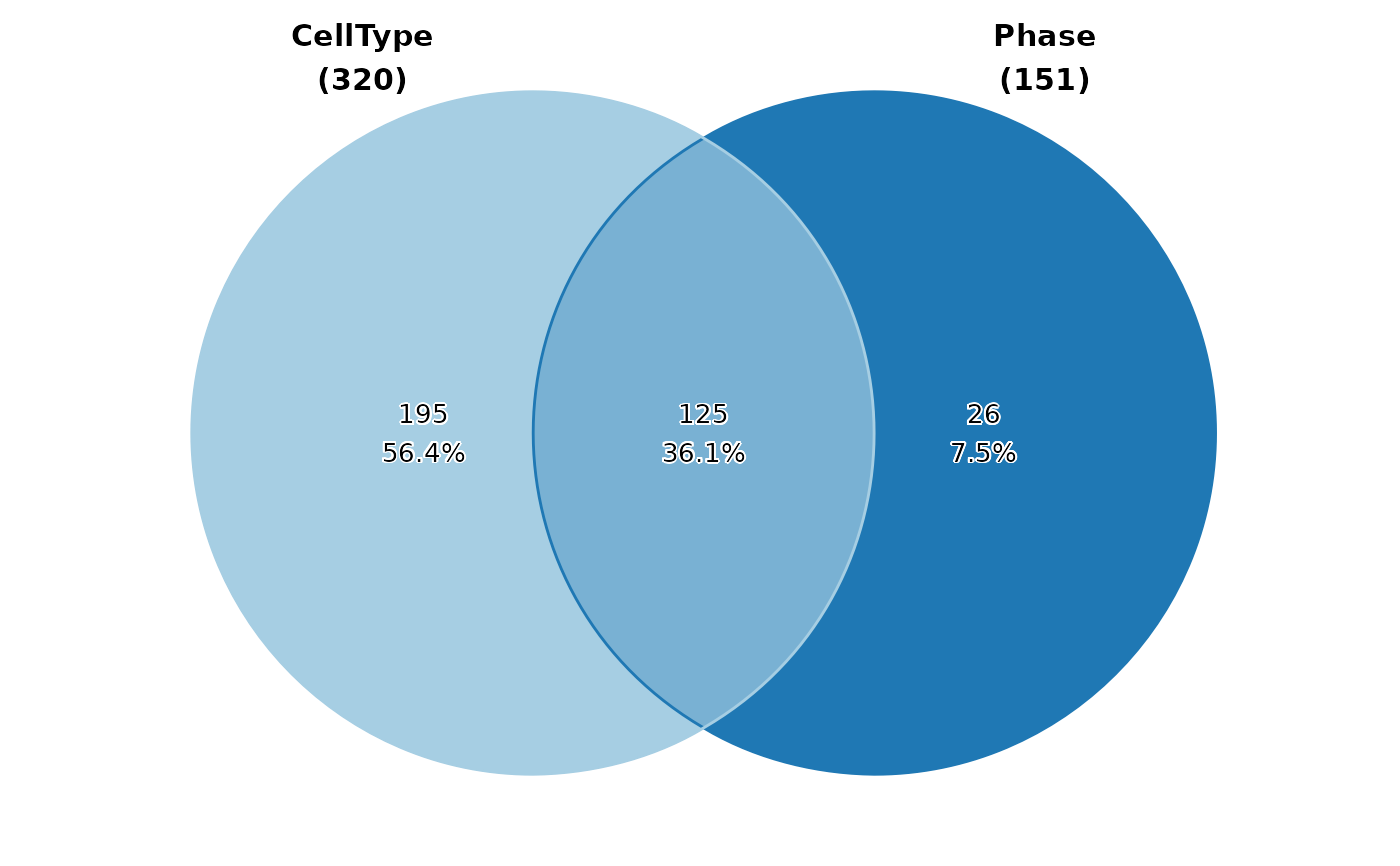
 ClassStatPlot(pancreas_sub,
stat.by = c("CellType", "Phase"), plot_type = "venn",
stat_level = list(CellType = c("Ductal", "Ngn3 low EP"), Phase = "S")
)
ClassStatPlot(pancreas_sub,
stat.by = c("CellType", "Phase"), plot_type = "venn",
stat_level = list(CellType = c("Ductal", "Ngn3 low EP"), Phase = "S")
)
 pancreas_sub$Ductal <- ifelse(pancreas_sub$CellType %in% c("Ductal", "Ngn3 low EP", "Ngn3 high EP"), TRUE, FALSE)
pancreas_sub$Endocrine <- ifelse(pancreas_sub$CellType %in% c("Pre-endocrine", "Endocrine"), TRUE, FALSE)
pancreas_sub$G1S <- ifelse(pancreas_sub$Phase %in% c("G1", "S"), TRUE, FALSE)
pancreas_sub$G2M <- ifelse(pancreas_sub$Phase %in% c("G2M"), TRUE, FALSE)
head(pancreas_sub@meta.data[, c("Ductal", "Endocrine", "G1S", "G2M")])
#> Ductal Endocrine G1S G2M
#> CAGCCGAAGCGATATA TRUE FALSE FALSE TRUE
#> AGTGTCATCGCCGTGA FALSE TRUE TRUE FALSE
#> GATGAAAAGTTGTAGA TRUE FALSE FALSE TRUE
#> CACAGTACATCCGTGG FALSE TRUE TRUE FALSE
#> CGGAGCTCATTGGGCC TRUE FALSE FALSE TRUE
#> AGAGCTTGTGTGACCC TRUE FALSE TRUE FALSE
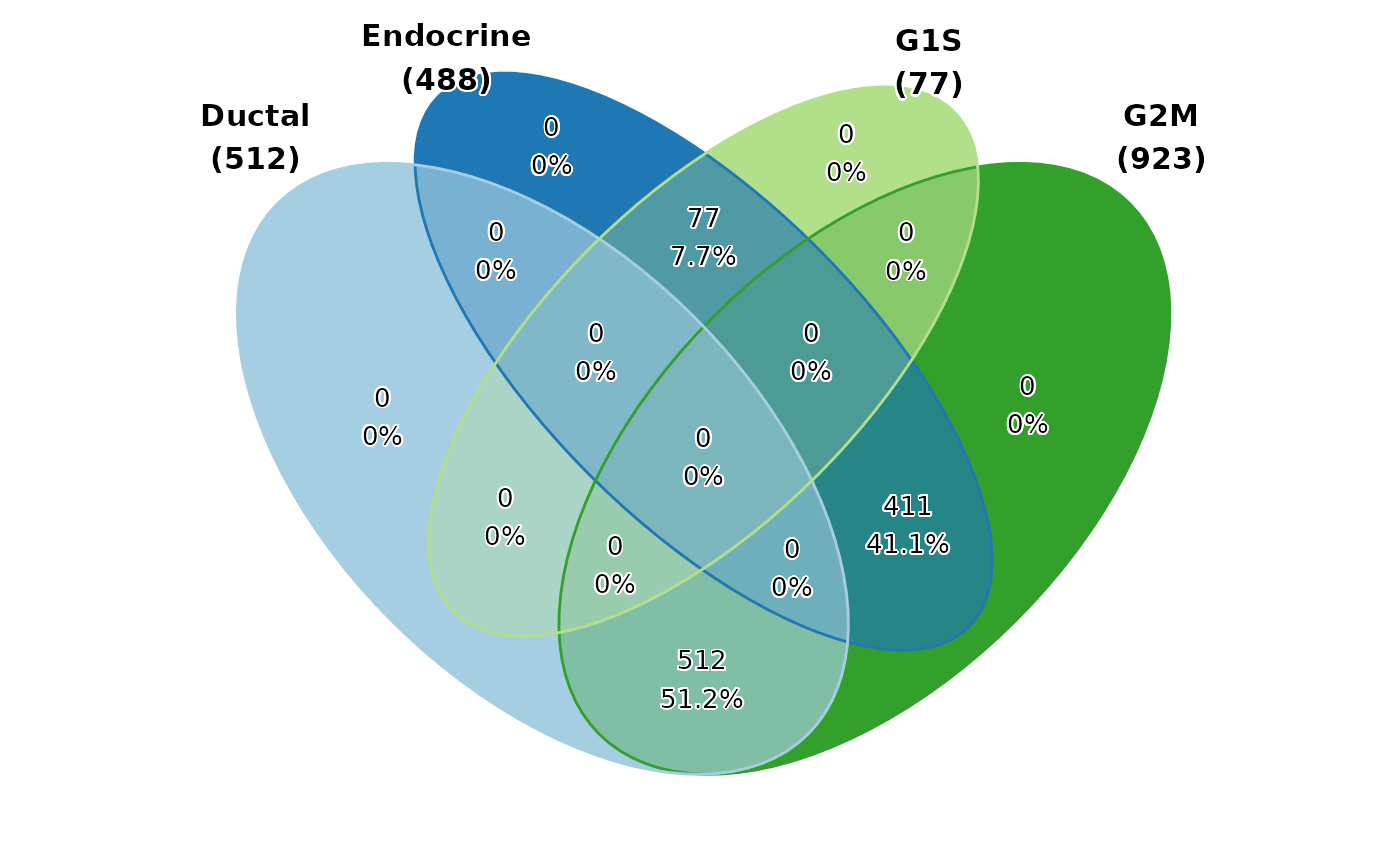
ClassStatPlot(pancreas_sub, stat.by = c("Ductal", "Endocrine", "G1S", "G2M"), plot_type = "venn")
#> stat_level is set to FALSE,FALSE,FALSE,FALSE
pancreas_sub$Ductal <- ifelse(pancreas_sub$CellType %in% c("Ductal", "Ngn3 low EP", "Ngn3 high EP"), TRUE, FALSE)
pancreas_sub$Endocrine <- ifelse(pancreas_sub$CellType %in% c("Pre-endocrine", "Endocrine"), TRUE, FALSE)
pancreas_sub$G1S <- ifelse(pancreas_sub$Phase %in% c("G1", "S"), TRUE, FALSE)
pancreas_sub$G2M <- ifelse(pancreas_sub$Phase %in% c("G2M"), TRUE, FALSE)
head(pancreas_sub@meta.data[, c("Ductal", "Endocrine", "G1S", "G2M")])
#> Ductal Endocrine G1S G2M
#> CAGCCGAAGCGATATA TRUE FALSE FALSE TRUE
#> AGTGTCATCGCCGTGA FALSE TRUE TRUE FALSE
#> GATGAAAAGTTGTAGA TRUE FALSE FALSE TRUE
#> CACAGTACATCCGTGG FALSE TRUE TRUE FALSE
#> CGGAGCTCATTGGGCC TRUE FALSE FALSE TRUE
#> AGAGCTTGTGTGACCC TRUE FALSE TRUE FALSE
ClassStatPlot(pancreas_sub, stat.by = c("Ductal", "Endocrine", "G1S", "G2M"), plot_type = "venn")
#> stat_level is set to FALSE,FALSE,FALSE,FALSE
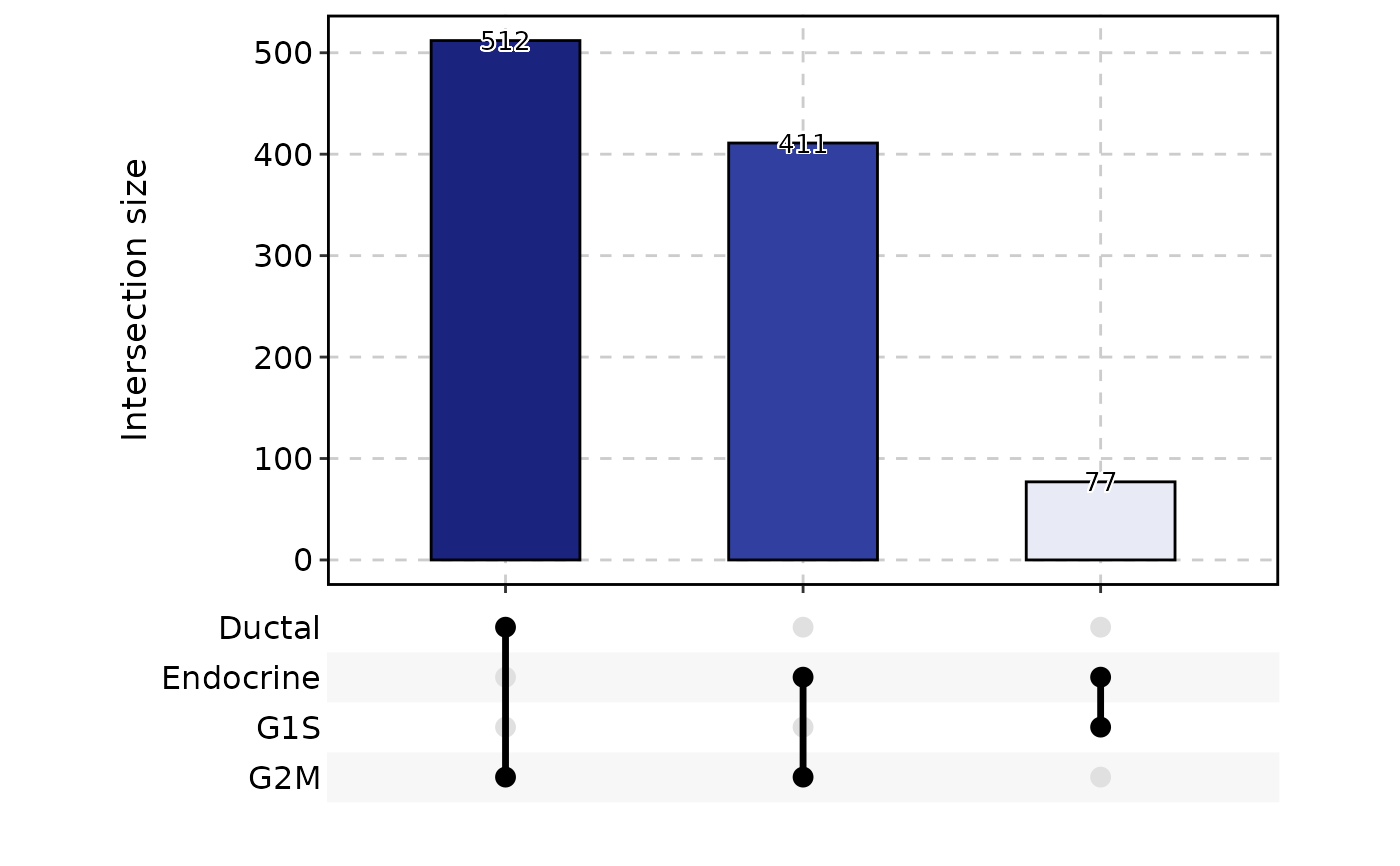
 ClassStatPlot(pancreas_sub, stat.by = c("Ductal", "Endocrine", "G1S", "G2M"), plot_type = "upset")
#> stat_level is set to FALSE,FALSE,FALSE,FALSE
ClassStatPlot(pancreas_sub, stat.by = c("Ductal", "Endocrine", "G1S", "G2M"), plot_type = "upset")
#> stat_level is set to FALSE,FALSE,FALSE,FALSE