This function generates a statistical plot for features.
Usage
FeatureStatPlot(
  srt,
  stat.by,
  group.by = NULL,
  split.by = NULL,
  bg.by = NULL,
  plot.by = c("group", "feature"),
  fill.by = c("group", "feature", "expression"),
  cells = NULL,
  slot = "data",
  assay = NULL,
  keep_empty = FALSE,
  individual = FALSE,
  plot_type = c("violin", "box", "bar", "dot", "col"),
  palette = "Paired",
  palcolor = NULL,
  alpha = 1,
  bg_palette = "Paired",
  bg_palcolor = NULL,
  bg_alpha = 0.2,
  add_box = FALSE,
  box_color = "black",
  box_width = 0.1,
  box_ptsize = 2,
  add_point = FALSE,
  pt.color = "grey30",
  pt.size = NULL,
  pt.alpha = 1,
  jitter.width = 0.4,
  jitter.height = 0.1,
  add_trend = FALSE,
  trend_color = "black",
  trend_linewidth = 1,
  trend_ptsize = 2,
  add_stat = c("none", "mean", "median"),
  stat_color = "black",
  stat_size = 1,
  stat_stroke = 1,
  stat_shape = 25,
  add_line = NULL,
  line_color = "red",
  line_size = 1,
  line_type = 1,
  cells.highlight = NULL,
  cols.highlight = "red",
  sizes.highlight = 1,
  alpha.highlight = 1,
  calculate_coexp = FALSE,
  same.y.lims = FALSE,
  y.min = NULL,
  y.max = NULL,
  y.trans = "identity",
  y.nbreaks = 5,
  sort = FALSE,
  stack = FALSE,
  flip = FALSE,
  comparisons = NULL,
  ref_group = NULL,
  pairwise_method = "wilcox.test",
  multiplegroup_comparisons = FALSE,
  multiple_method = "kruskal.test",
  sig_label = c("p.signif", "p.format"),
  sig_labelsize = 3.5,
  aspect.ratio = NULL,
  title = NULL,
  subtitle = NULL,
  xlab = NULL,
  ylab = "Expression level",
  legend.position = "right",
  legend.direction = "vertical",
  theme_use = "theme_scp",
  theme_args = list(),
  combine = TRUE,
  nrow = NULL,
  ncol = NULL,
  byrow = TRUE,
  force = FALSE,
  seed = 11
)
Arguments
- srt
A Seurat object.
- stat.by
A character vector specifying the features to plot.
- group.by
A character vector specifying the groups to group by. Default is NULL.
- split.by
A character vector specifying the variable to split the plot by. Default is NULL.
- bg.by
A character vector specifying the variable to use as the background color. Default is NULL.
- plot.by
A character vector specifying how to plot the data, by group or feature. Possible values are "group", "feature". Default is "group".
- fill.by
A string specifying what to fill the plot by. Possible values are "group", "feature", or "expression". Default is "group".
- cells
A character vector specifying the cells to include in the plot. Default is NULL.
- slot
A string specifying which slot of the Seurat object to use. Default is "data".
- assay
A string specifying which assay to use. Default is NULL.
- keep_empty
A logical indicating whether to keep empty levels in the plot. Default is FALSE.
- individual
A logical indicating whether to create individual plots for each group. Default is FALSE.
- plot_type
A string specifying the type of plot to create. Possible values are "violin", "box", "bar", "dot", or "col". Default is "violin".
- palette
A string specifying the color palette to use for filling. Default is "Paired".
- palcolor
A character vector specifying specific colors to use for filling. Default is NULL.
- alpha
A numeric value specifying the transparency of the plot. Default is 1.
- bg_palette
A string specifying the color palette to use for the background. Default is "Paired".
- bg_palcolor
A character vector specifying specific colors to use for the background. Default is NULL.
- bg_alpha
A numeric value specifying the transparency of the background. Default is 0.2.
- add_box
A logical indicating whether to add a box plot to the plot. Default is FALSE.
- box_color
A string specifying the color of the box plot. Default is "black".
- box_width
A numeric value specifying the width of the box plot. Default is 0.1.
- box_ptsize
A numeric value specifying the size of the points of the box plot. Default is 2.
- add_point
A logical indicating whether to add individual data points to the plot. Default is FALSE.
- pt.color
A string specifying the color of the data points. Default is "grey30".
- pt.size
A numeric value specifying the size of the data points. If NULL, the size is automatically determined. Default is NULL.
- pt.alpha
A numeric value specifying the transparency of the data points. Default is 1.
- jitter.width
A numeric value specifying the width of the jitter. Default is 0.5.
- jitter.height
A numeric value specifying the height of the jitter. Default is 0.1.
- add_trend
A logical indicating whether to add a trend line to the plot. Default is FALSE.
- trend_color
A string specifying the color of the trend line. Default is "black".
- trend_linewidth
A numeric value specifying the width of the trend line. Default is 1.
- trend_ptsize
A numeric value specifying the size of the points of the trend line. Default is 2.
- add_stat
A string specifying which statistical summary to add to the plot. Possible values are "none", "mean", or "median". Default is "none".
- stat_color
A string specifying the color of the statistical summary. Default is "black".
- stat_size
A numeric value specifying the size of the statistical summary. Default is 1.
- cells.highlight
A logical or character vector specifying the cells to highlight in the plot. If TRUE, all cells are highlighted. If FALSE, no cells are highlighted. Default is NULL.
- cols.highlight
A string specifying the color of the highlighted cells. Default is "red".
- sizes.highlight
A numeric value specifying the size of the highlighted cells. Default is 1.
- alpha.highlight
A numeric value specifying the transparency of the highlighted cells. Default is 1.
- calculate_coexp
A logical indicating whether to calculate co-expression values. Default is FALSE.
- same.y.lims
A logical indicating whether to use the same y-axis limits for all plots. Default is FALSE.
- y.min
A numeric or character value specifying the minimum y-axis limit. If a character value is provided, it must be of the form "qN" where N is a number between 0 and 100 (inclusive) representing the quantile to use for the limit. Default is NULL.
- y.max
A numeric or character value specifying the maximum y-axis limit. If a character value is provided, it must be of the form "qN" where N is a number between 0 and 100 (inclusive) representing the quantile to use for the limit. Default is NULL.
- y.trans
A string specifying the transformation to apply to the y-axis. Possible values are "identity" or "log2". Default is "identity".
- y.nbreaks
An integer specifying the number of breaks to use for the y-axis. Default is 5.
- sort
A logical or character value specifying whether to sort the groups on the x-axis. If TRUE, groups are sorted in increasing order. If FALSE, groups are not sorted. If "increasing", groups are sorted in increasing order. If "decreasing", groups are sorted in decreasing order. Default is FALSE.
- stack
A logical specifying whether to stack the plots on top of each other. Default is FALSE.
- flip
A logical specifying whether to flip the plot vertically. Default is FALSE.
- comparisons
A list of length-2 vectors. The entries in the vector are either the names of 2 values on the x-axis or the 2 integers that correspond to the index of the groups of interest, to be compared.
- ref_group
A string specifying the reference group for pairwise comparisons. Default is NULL.
- pairwise_method
A string specifying the method to use for pairwise comparisons. Default is "wilcox.test".
- multiplegroup_comparisons
A logical indicating whether to add multiple group comparisons to the plot. Default is FALSE.
- multiple_method
A string specifying the method to use for multiple group comparisons. Default is "kruskal.test".
- sig_label
A string specifying the label to use for significant comparisons. Possible values are "p.signif" or "p.format". Default is "p.format".
- sig_labelsize
A numeric value specifying the size of the significant comparison labels. Default is 3.5.
- aspect.ratio
A numeric value specifying the aspect ratio of the plot. Default is NULL.
- title
A string specifying the title of the plot. Default is NULL.
- subtitle
A string specifying the subtitle of the plot. Default is NULL.
- xlab
A string specifying the label of the x-axis. Default is NULL.
- ylab
A string specifying the label of the y-axis. Default is "Expression level".
- legend.position
A string specifying the position of the legend. Possible values are "right", "left", "top", "bottom", or "none". Default is "right".
- legend.direction
A string specifying the direction of the legend. Possible values are "vertical" or "horizontal". Default is "vertical".
- theme_use
A string specifying the theme to use for the plot. Default is "theme_scp".
- theme_args
A list of arguments to pass to the theme function. Default is an empty list.
- combine
A logical indicating whether to combine the individual plots into a single plot. Default is TRUE.
- nrow
An integer specifying the number of rows for the combined plot. Default is NULL.
- ncol
An integer specifying the number of columns for the combined plot. Default is NULL.
- byrow
A logical specifying whether to fill the combined plot by row or by column. Default is TRUE.
- force
A logical indicating whether to force the plot creation even if there are more than 100 levels in a variable. Default is FALSE.
- seed
An integer specifying the random seed to use for generating jitter. Default is 11.
Examples
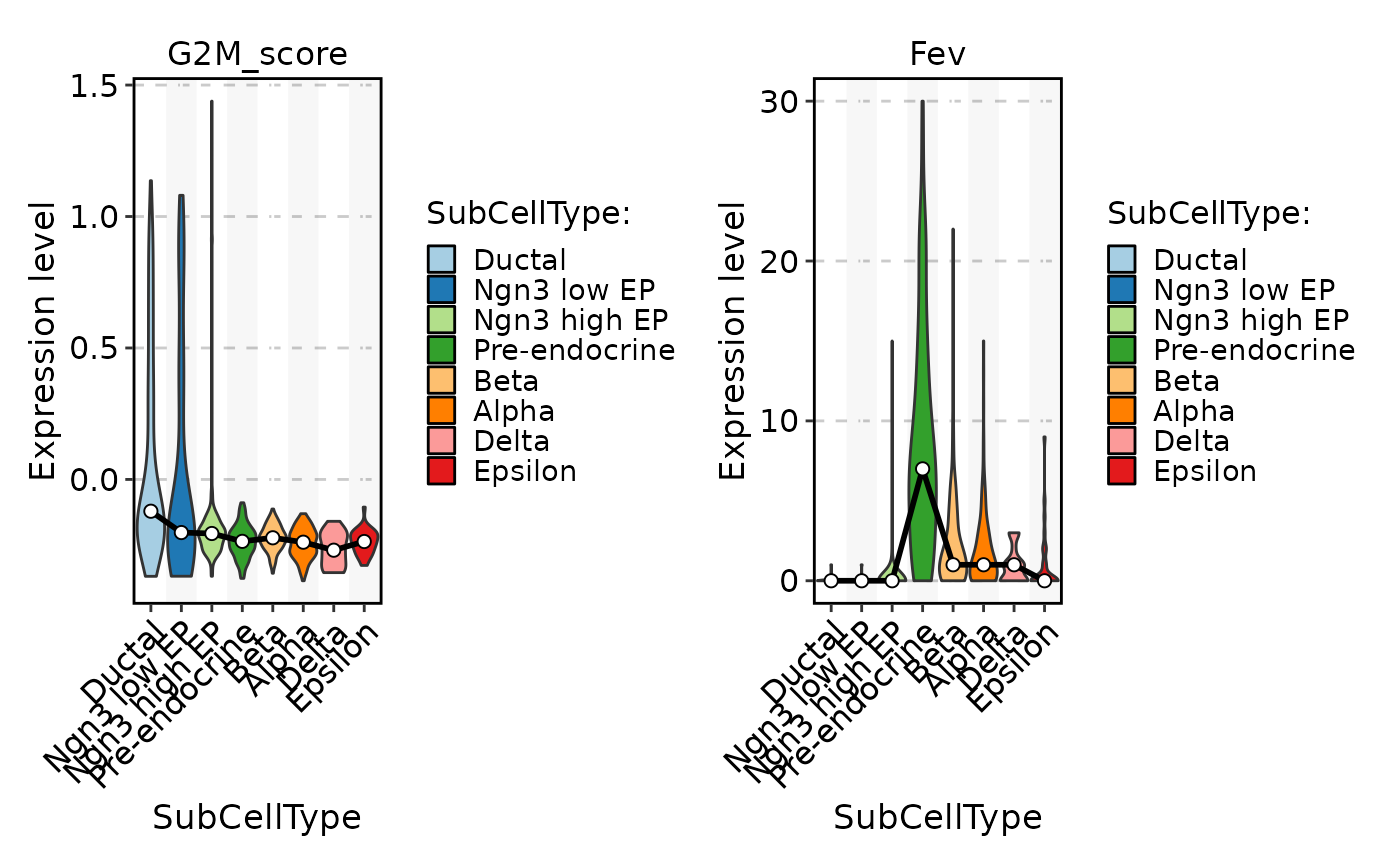
data("pancreas_sub")
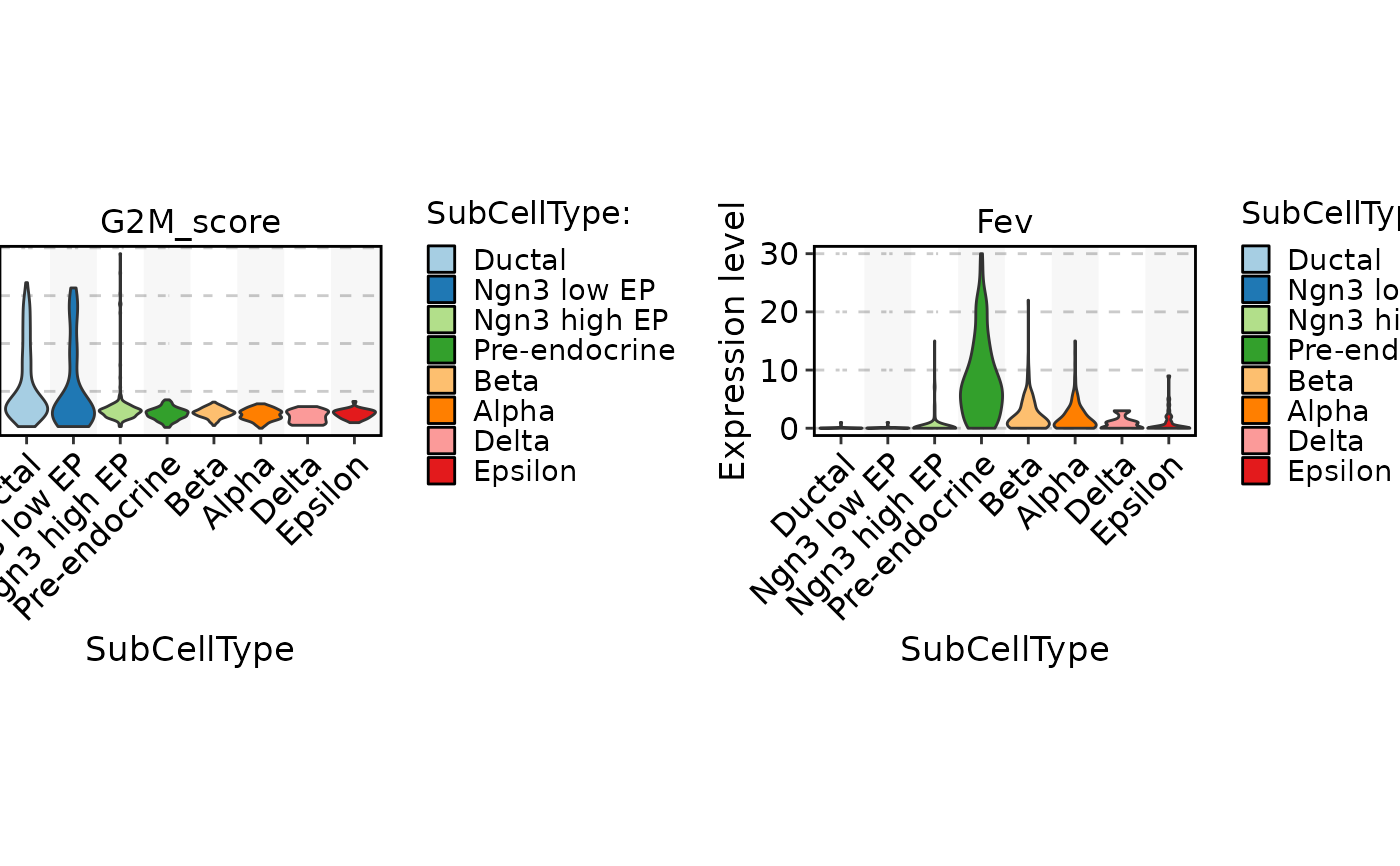
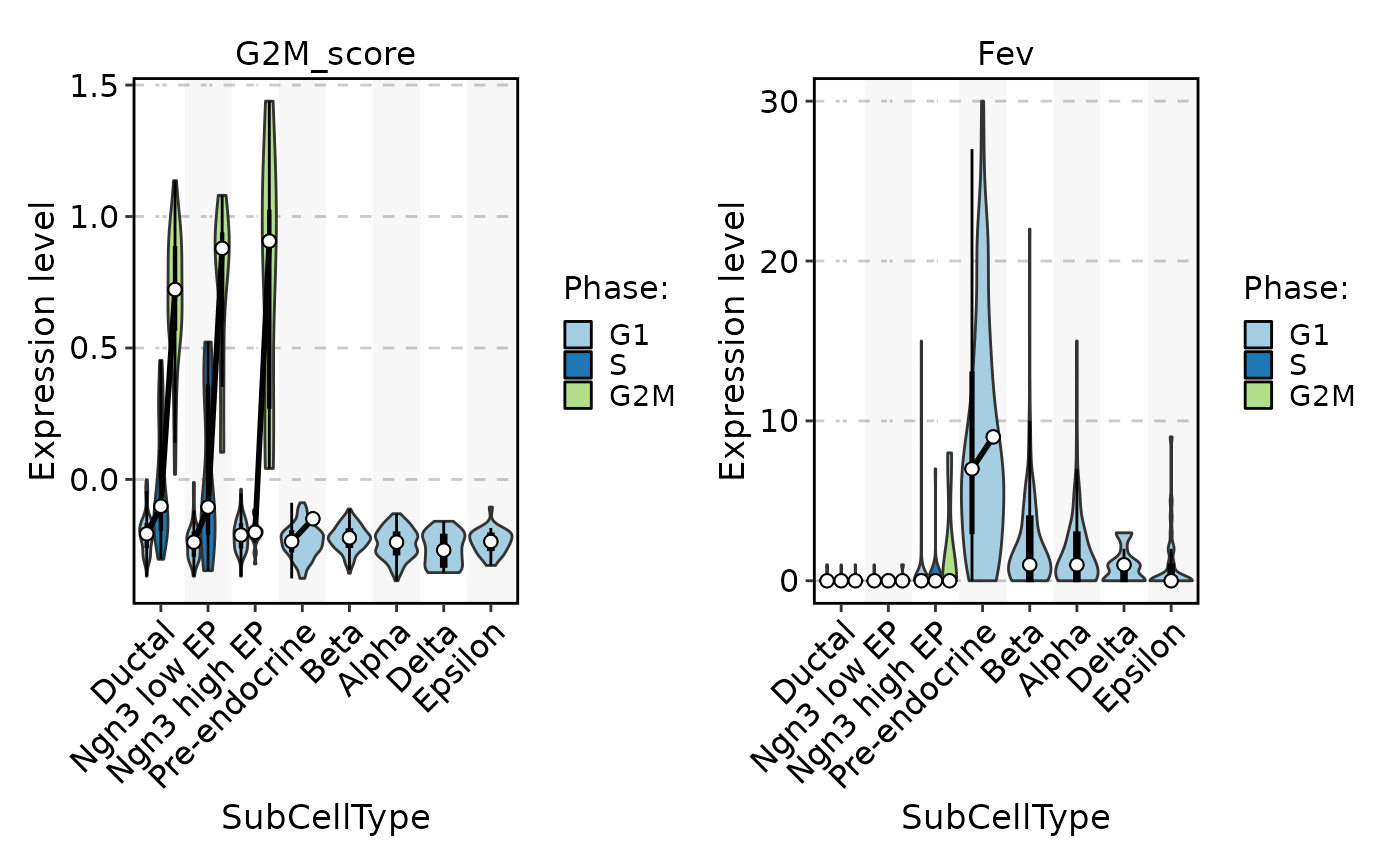
FeatureStatPlot(pancreas_sub, stat.by = c("G2M_score", "Fev"), group.by = "SubCellType")
 FeatureStatPlot(pancreas_sub, stat.by = c("G2M_score", "Fev"), group.by = "SubCellType") %>% panel_fix(height = 1, width = 2)
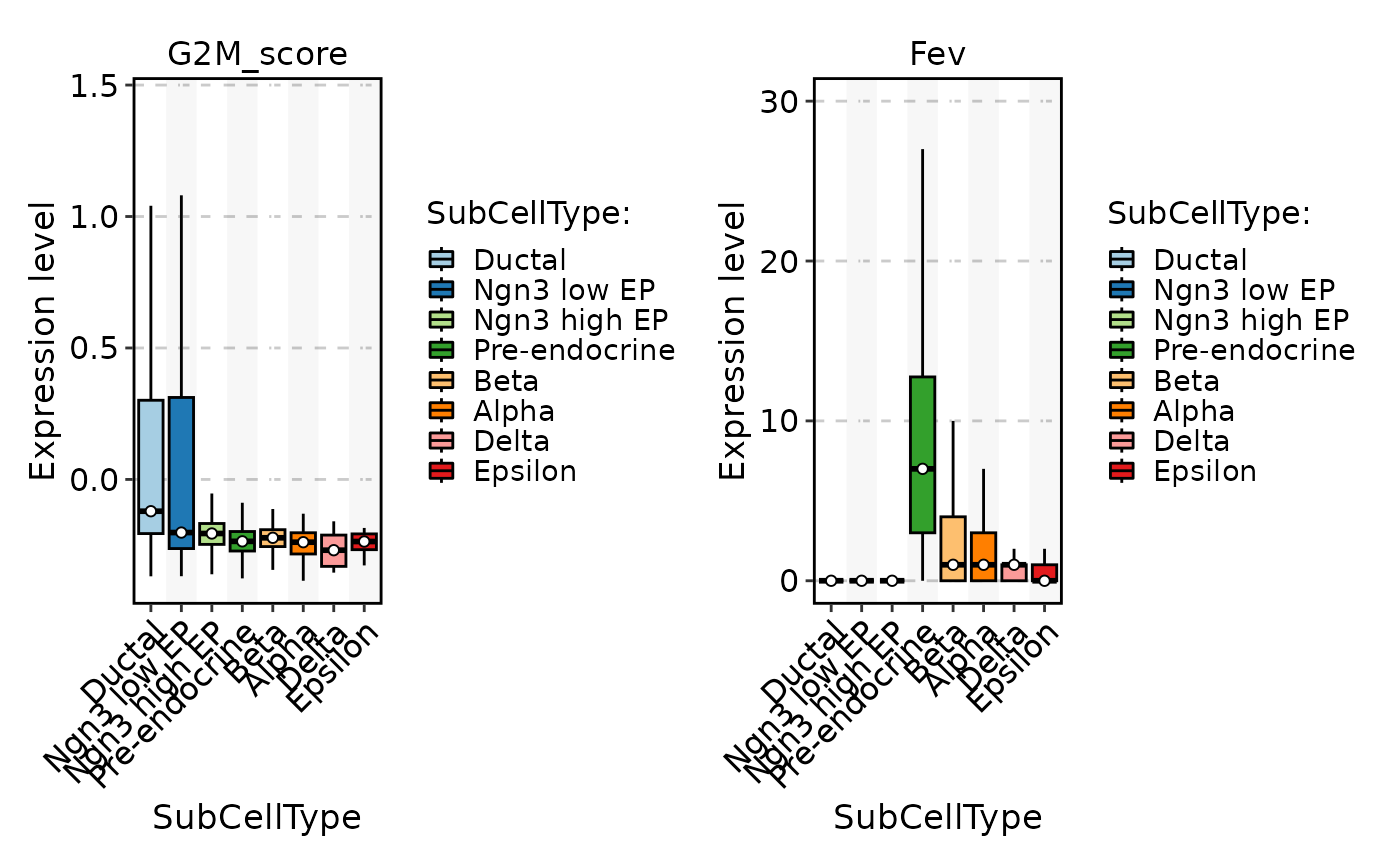
 FeatureStatPlot(pancreas_sub, stat.by = c("G2M_score", "Fev"), group.by = "SubCellType", plot_type = "box")
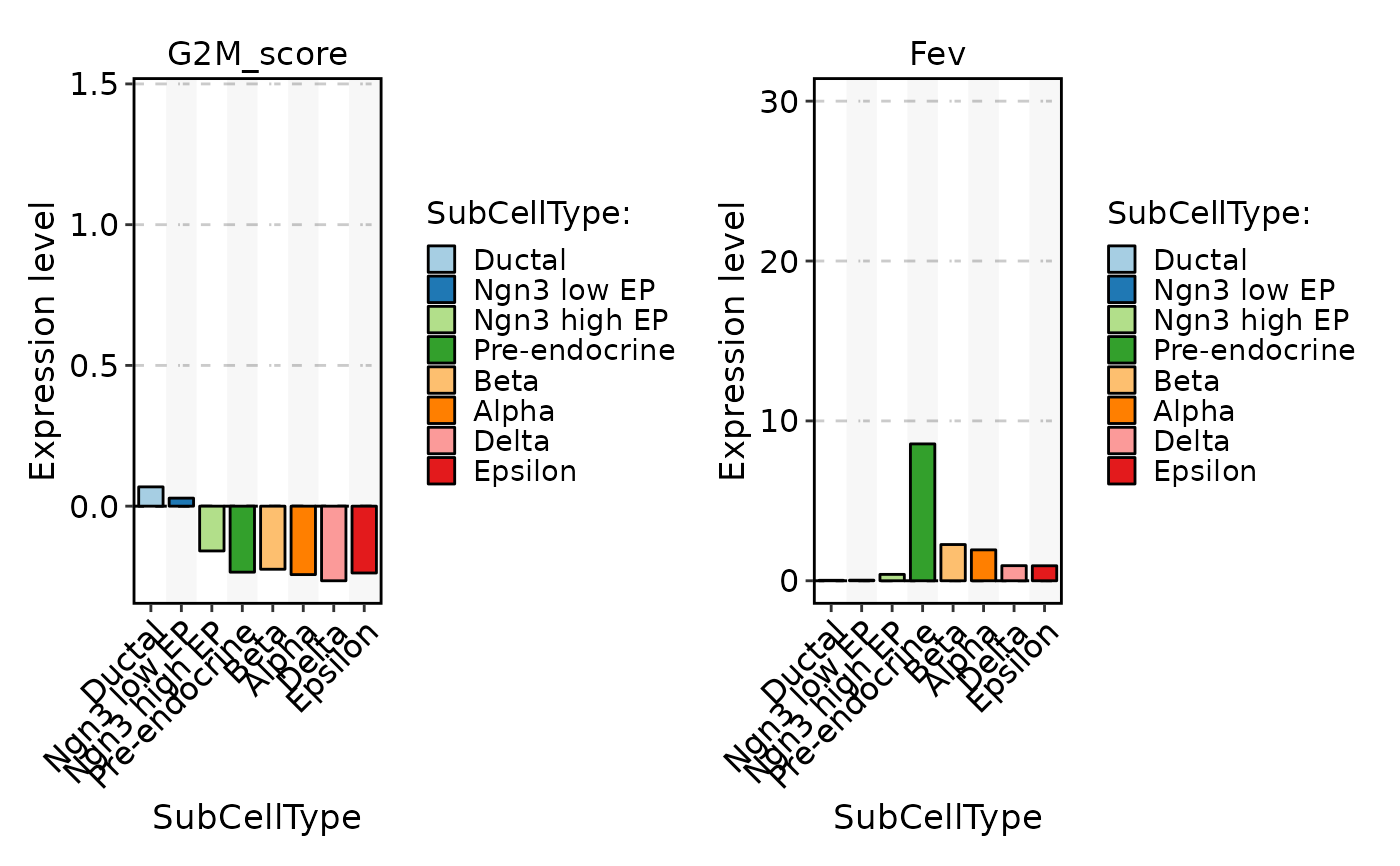
 FeatureStatPlot(pancreas_sub, stat.by = c("G2M_score", "Fev"), group.by = "SubCellType", plot_type = "bar")
#> Warning: Computation failed in `stat_summary()`
#> Caused by error in `fun.data()`:
#> ! The package "Hmisc" is required.
#> Warning: Computation failed in `stat_summary()`
#> Caused by error in `fun.data()`:
#> ! The package "Hmisc" is required.
#> Warning: Computation failed in `stat_summary()`
#> Caused by error in `fun.data()`:
#> ! The package "Hmisc" is required.
#> Warning: Computation failed in `stat_summary()`
#> Caused by error in `fun.data()`:
#> ! The package "Hmisc" is required.
FeatureStatPlot(pancreas_sub, stat.by = c("G2M_score", "Fev"), group.by = "SubCellType", plot_type = "bar")
#> Warning: Computation failed in `stat_summary()`
#> Caused by error in `fun.data()`:
#> ! The package "Hmisc" is required.
#> Warning: Computation failed in `stat_summary()`
#> Caused by error in `fun.data()`:
#> ! The package "Hmisc" is required.
#> Warning: Computation failed in `stat_summary()`
#> Caused by error in `fun.data()`:
#> ! The package "Hmisc" is required.
#> Warning: Computation failed in `stat_summary()`
#> Caused by error in `fun.data()`:
#> ! The package "Hmisc" is required.
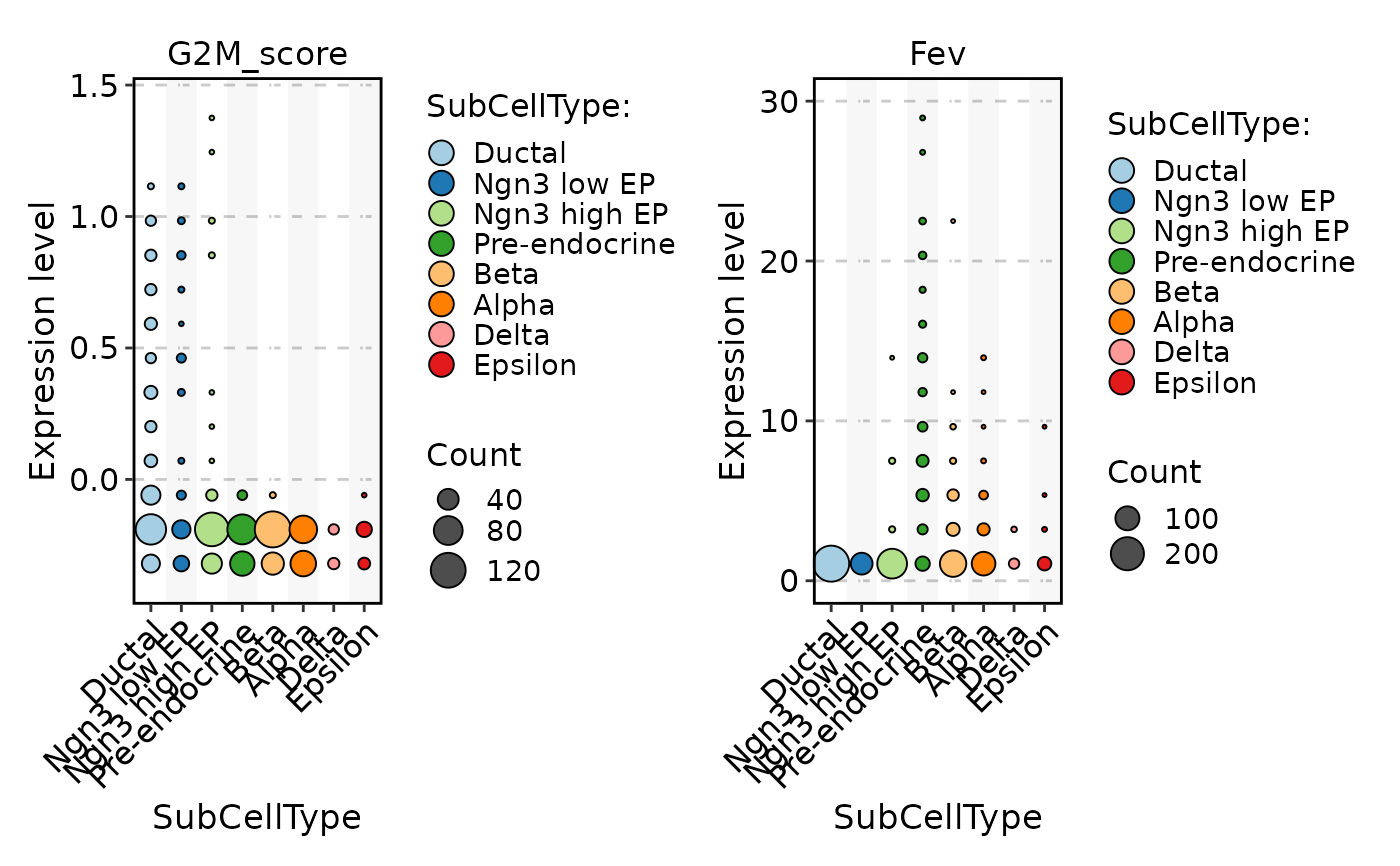
 FeatureStatPlot(pancreas_sub, stat.by = c("G2M_score", "Fev"), group.by = "SubCellType", plot_type = "dot")
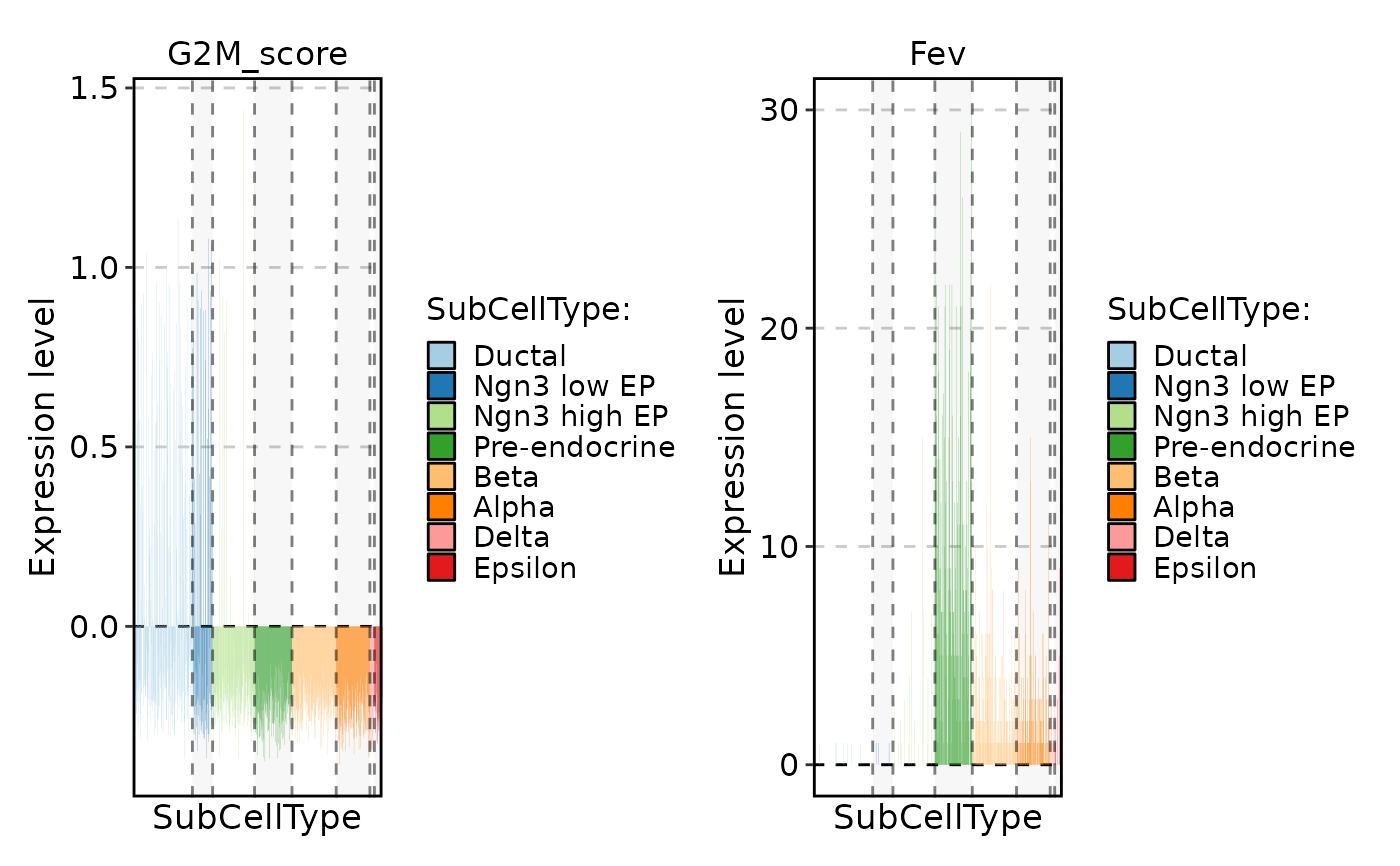
 FeatureStatPlot(pancreas_sub, stat.by = c("G2M_score", "Fev"), group.by = "SubCellType", plot_type = "col")
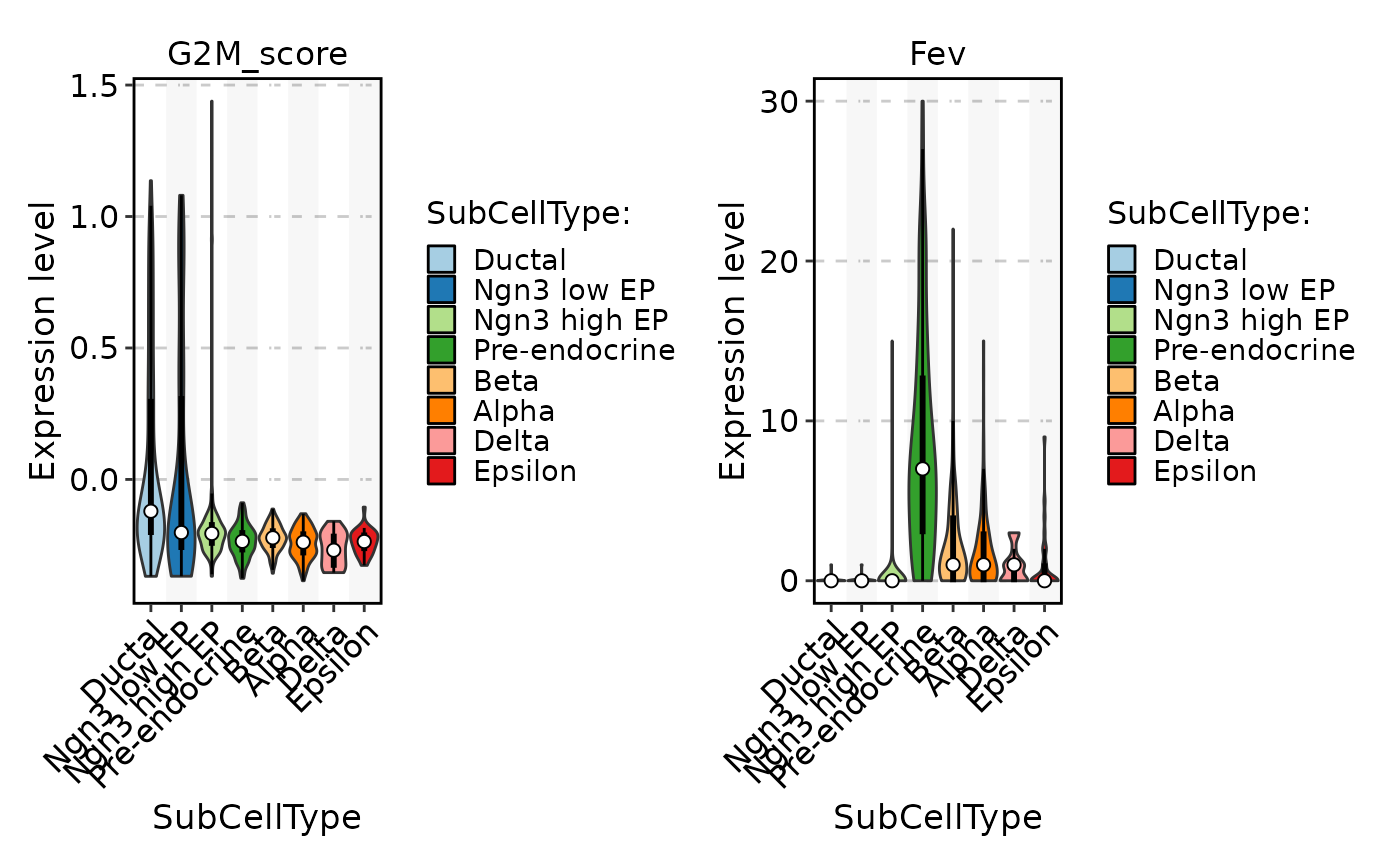
 FeatureStatPlot(pancreas_sub, stat.by = c("G2M_score", "Fev"), group.by = "SubCellType", add_box = TRUE)
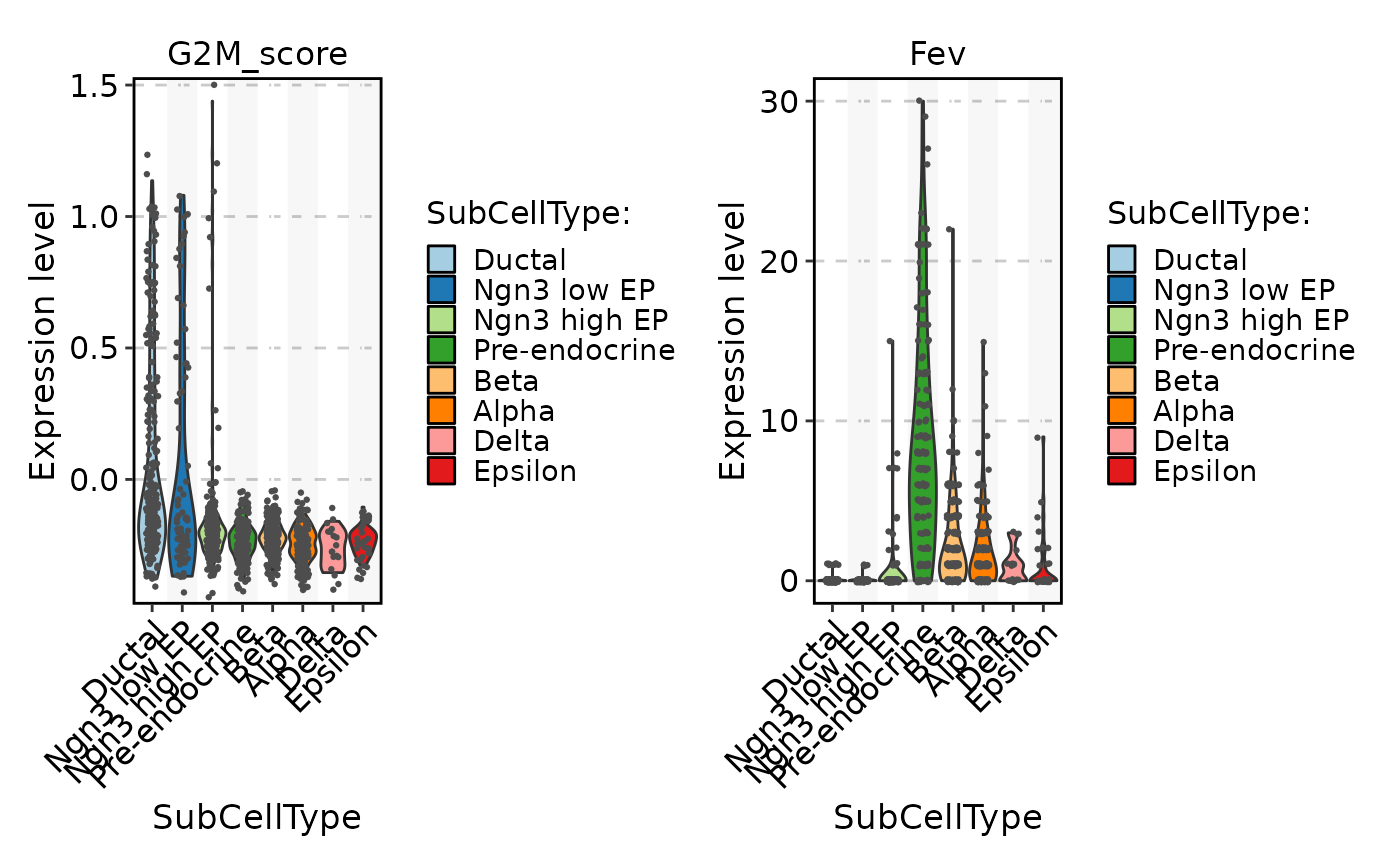
 FeatureStatPlot(pancreas_sub, stat.by = c("G2M_score", "Fev"), group.by = "SubCellType", add_point = TRUE)
 FeatureStatPlot(pancreas_sub, stat.by = c("G2M_score", "Fev"), group.by = "SubCellType", add_trend = TRUE)
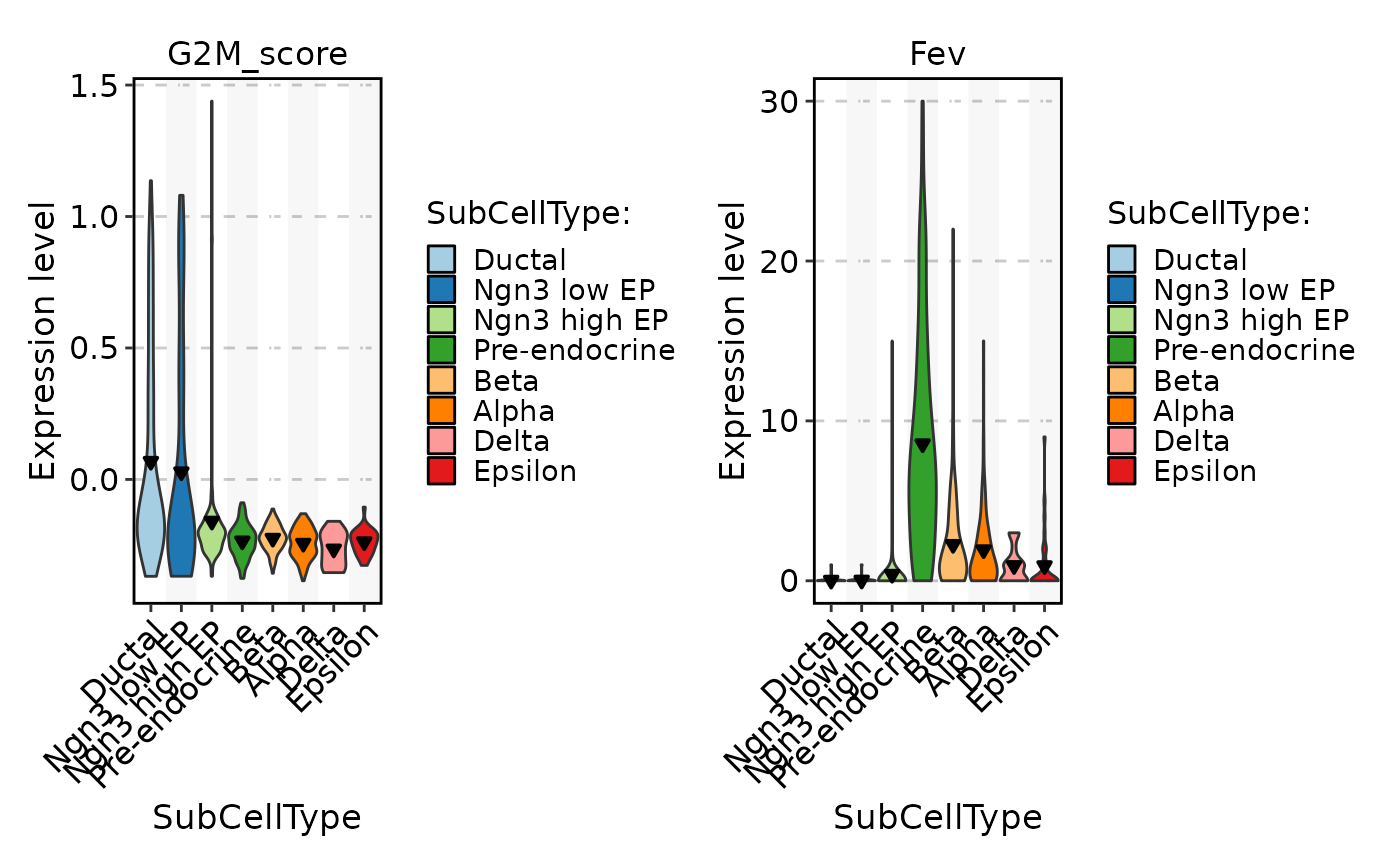
 FeatureStatPlot(pancreas_sub, stat.by = c("G2M_score", "Fev"), group.by = "SubCellType", add_stat = "mean")
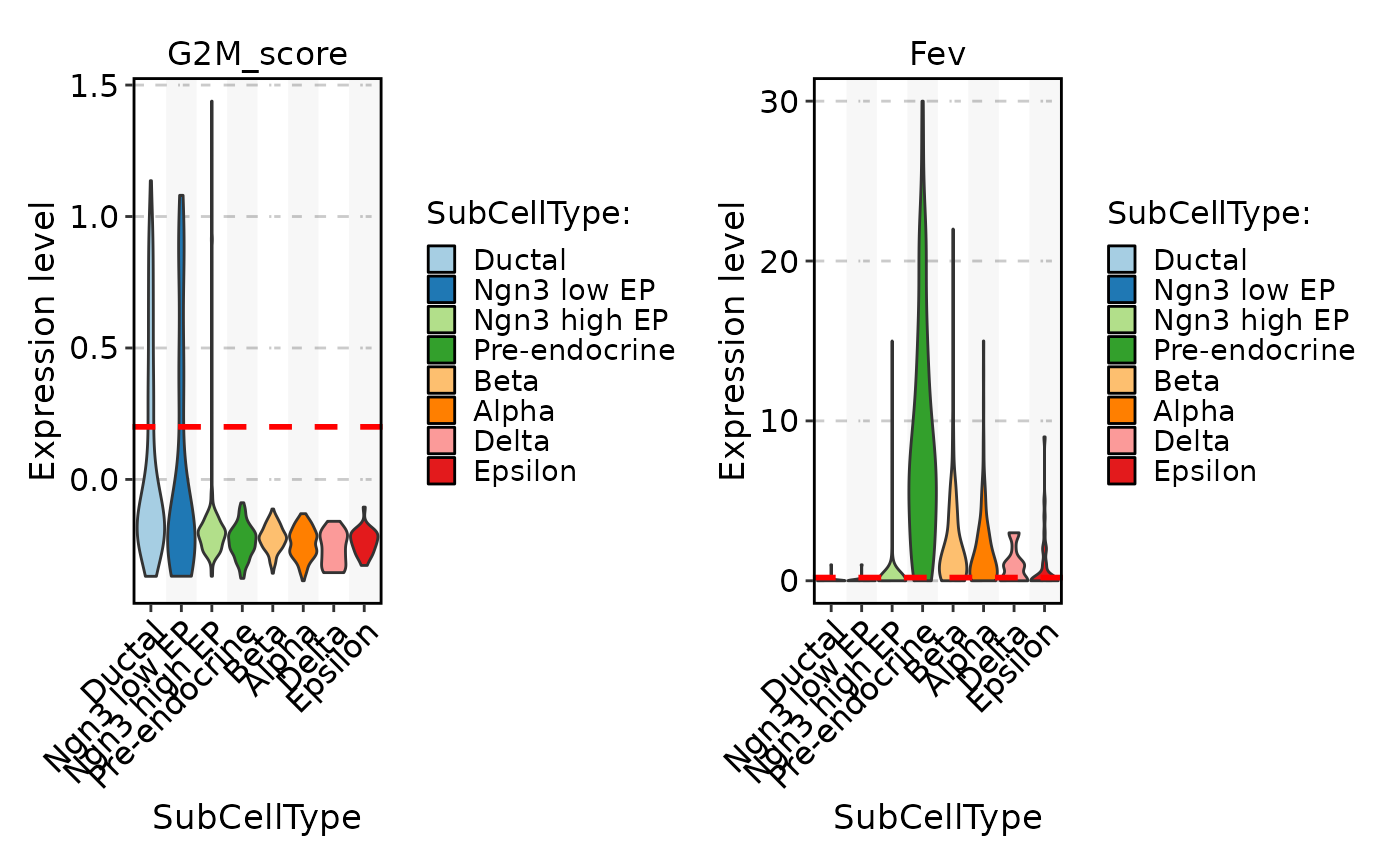
 FeatureStatPlot(pancreas_sub, stat.by = c("G2M_score", "Fev"), group.by = "SubCellType", add_line = 0.2, line_type = 2)
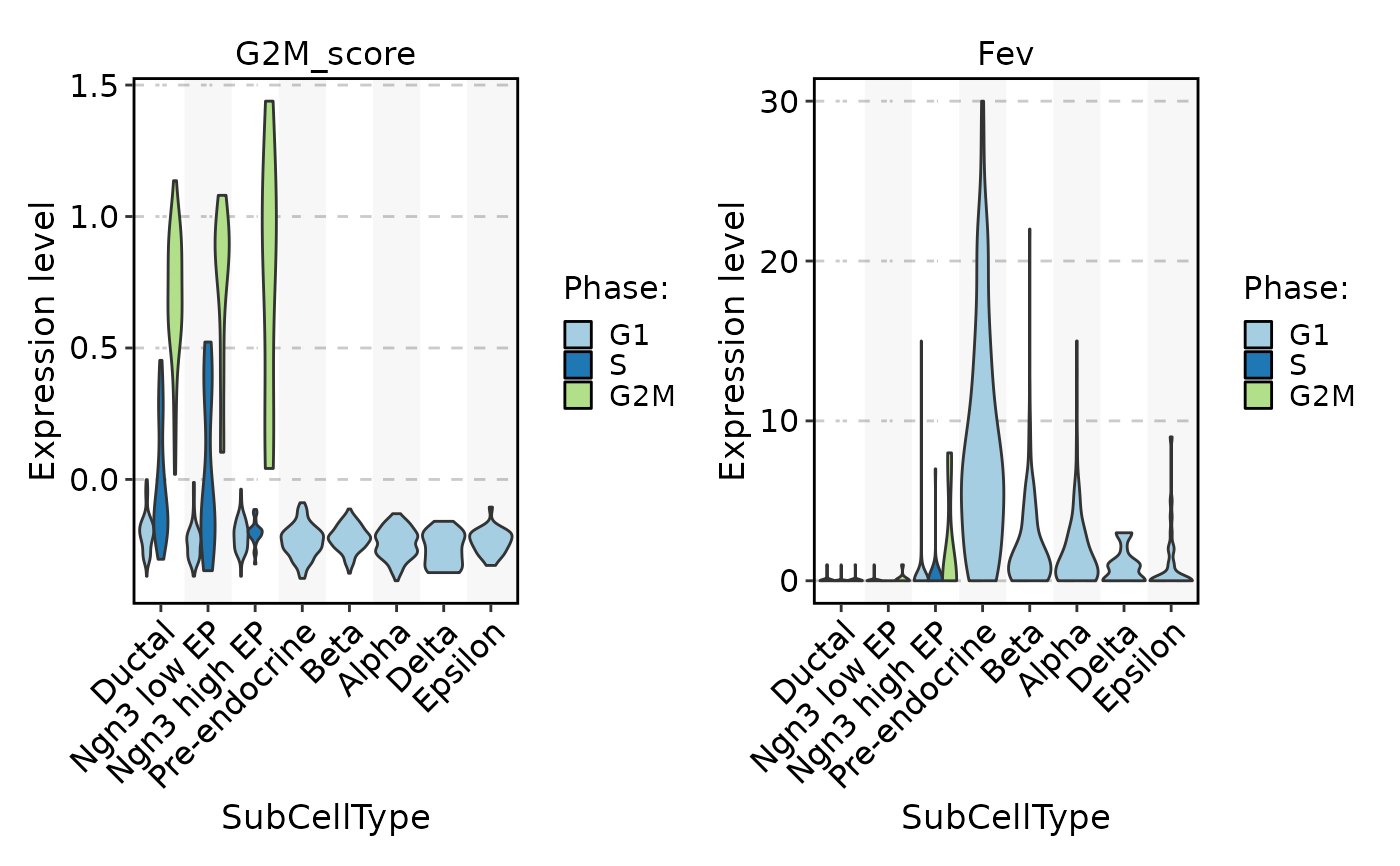
 FeatureStatPlot(pancreas_sub, stat.by = c("G2M_score", "Fev"), group.by = "SubCellType", split.by = "Phase")
#> Warning: Groups with fewer than two data points have been dropped.
#> Warning: Groups with fewer than two data points have been dropped.
FeatureStatPlot(pancreas_sub, stat.by = c("G2M_score", "Fev"), group.by = "SubCellType", split.by = "Phase")
#> Warning: Groups with fewer than two data points have been dropped.
#> Warning: Groups with fewer than two data points have been dropped.
 FeatureStatPlot(pancreas_sub, stat.by = c("G2M_score", "Fev"), group.by = "SubCellType", split.by = "Phase", add_box = TRUE, add_trend = TRUE)
#> Warning: Groups with fewer than two data points have been dropped.
#> Warning: Groups with fewer than two data points have been dropped.
#> Warning: Groups with fewer than two data points have been dropped.
#> Warning: Groups with fewer than two data points have been dropped.
FeatureStatPlot(pancreas_sub, stat.by = c("G2M_score", "Fev"), group.by = "SubCellType", split.by = "Phase", add_box = TRUE, add_trend = TRUE)
#> Warning: Groups with fewer than two data points have been dropped.
#> Warning: Groups with fewer than two data points have been dropped.
#> Warning: Groups with fewer than two data points have been dropped.
#> Warning: Groups with fewer than two data points have been dropped.
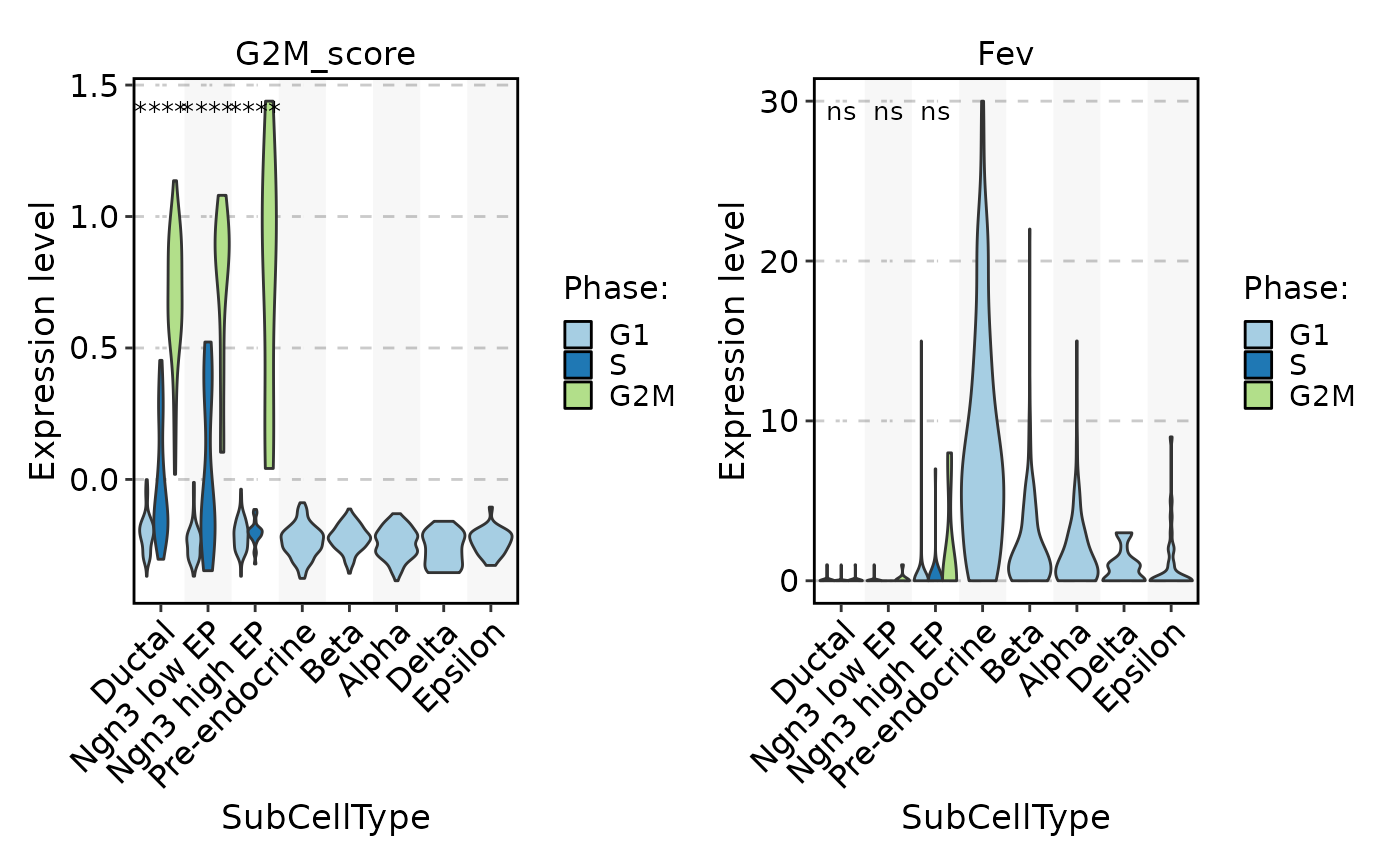
 FeatureStatPlot(pancreas_sub, stat.by = c("G2M_score", "Fev"), group.by = "SubCellType", split.by = "Phase", comparisons = TRUE)
#> Detected more than 2 groups. Use multiple_method for comparison
#> Warning: Groups with fewer than two data points have been dropped.
#> Detected more than 2 groups. Use multiple_method for comparison
#> Warning: Groups with fewer than two data points have been dropped.
#> Warning: Groups with fewer than two data points have been dropped.
#> Warning: Groups with fewer than two data points have been dropped.
FeatureStatPlot(pancreas_sub, stat.by = c("G2M_score", "Fev"), group.by = "SubCellType", split.by = "Phase", comparisons = TRUE)
#> Detected more than 2 groups. Use multiple_method for comparison
#> Warning: Groups with fewer than two data points have been dropped.
#> Detected more than 2 groups. Use multiple_method for comparison
#> Warning: Groups with fewer than two data points have been dropped.
#> Warning: Groups with fewer than two data points have been dropped.
#> Warning: Groups with fewer than two data points have been dropped.
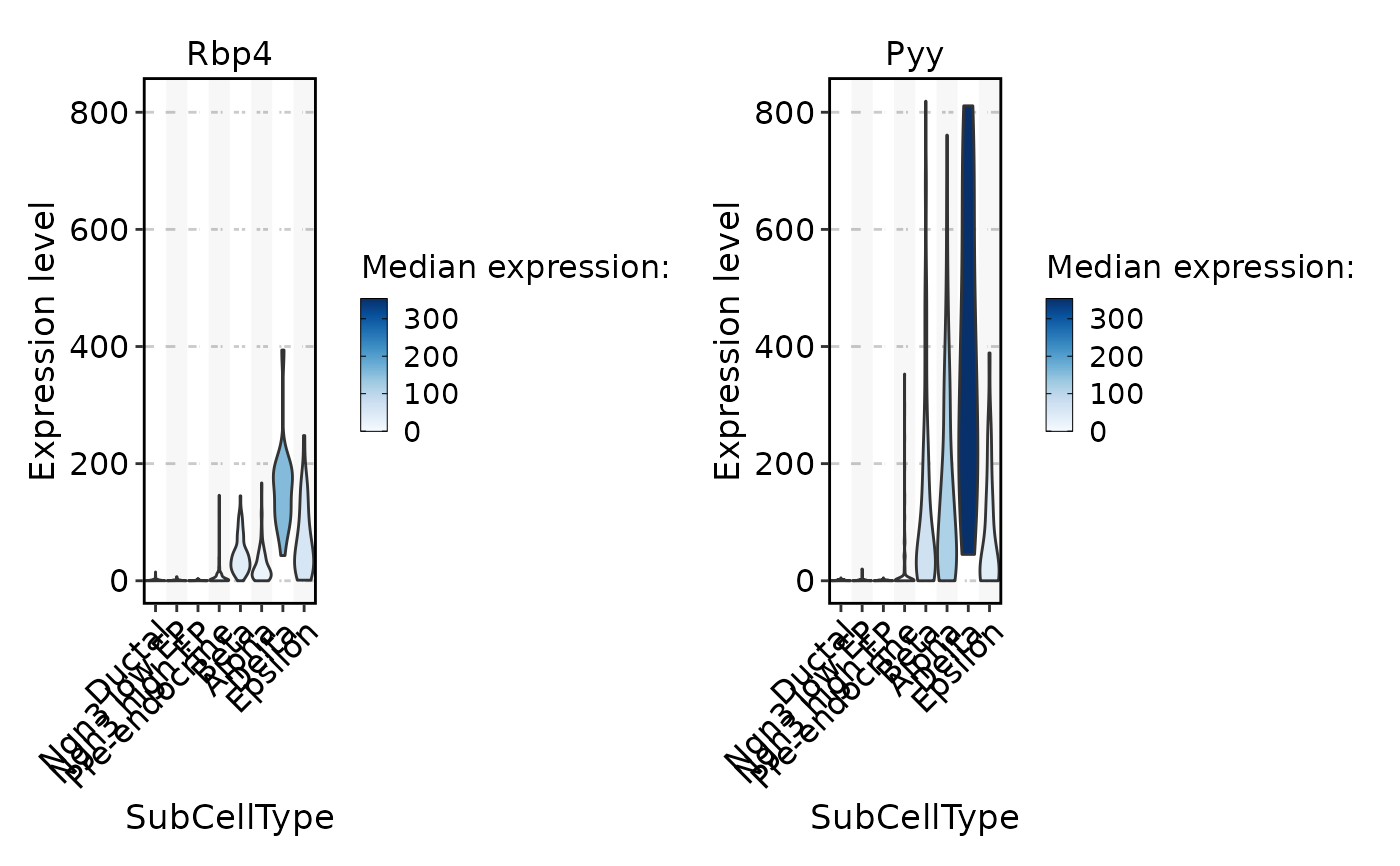
 FeatureStatPlot(pancreas_sub, stat.by = c("Rbp4", "Pyy"), group.by = "SubCellType", fill.by = "expression", palette = "Blues", same.y.lims = TRUE)
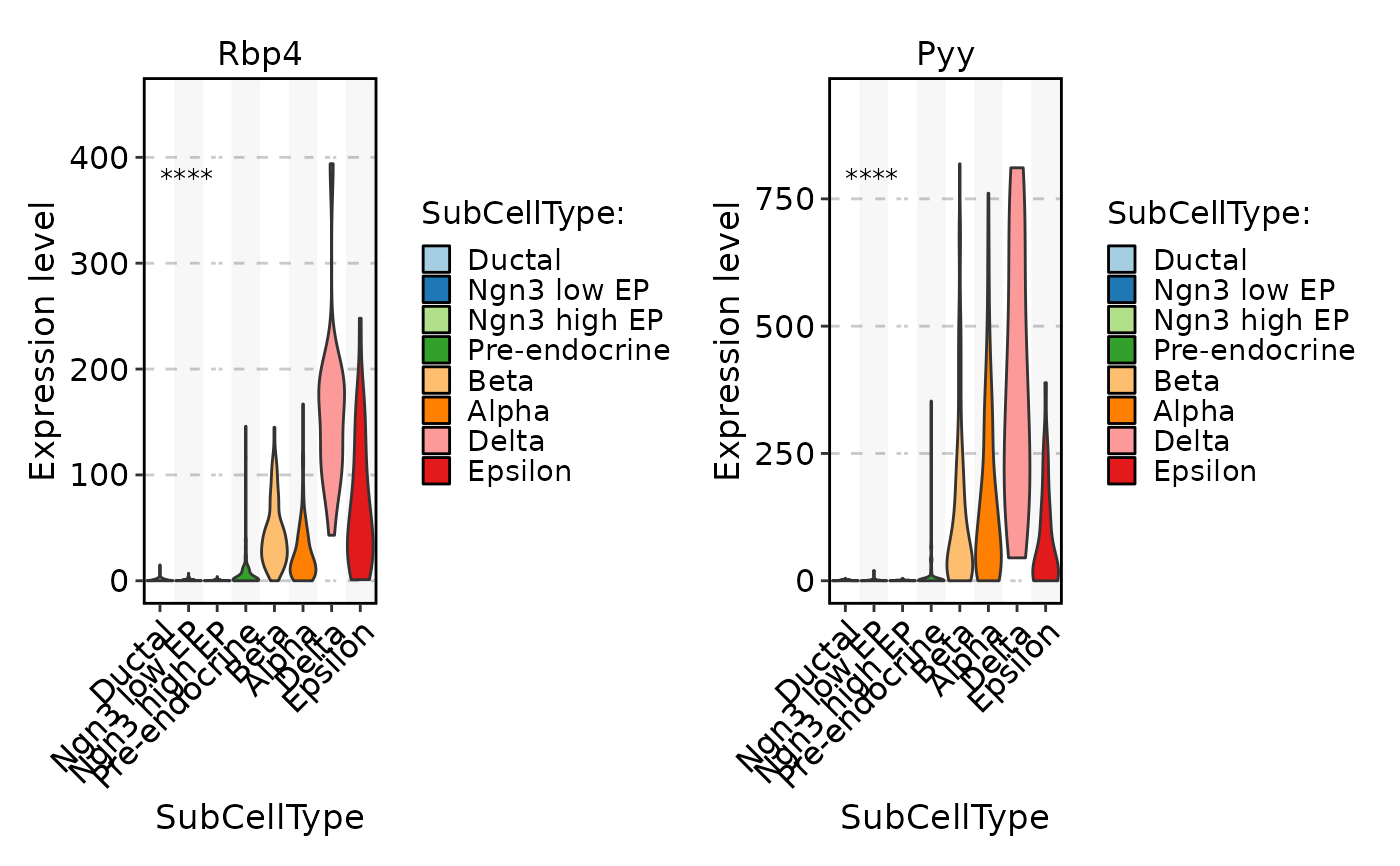
 FeatureStatPlot(pancreas_sub, stat.by = c("Rbp4", "Pyy"), group.by = "SubCellType", multiplegroup_comparisons = TRUE)
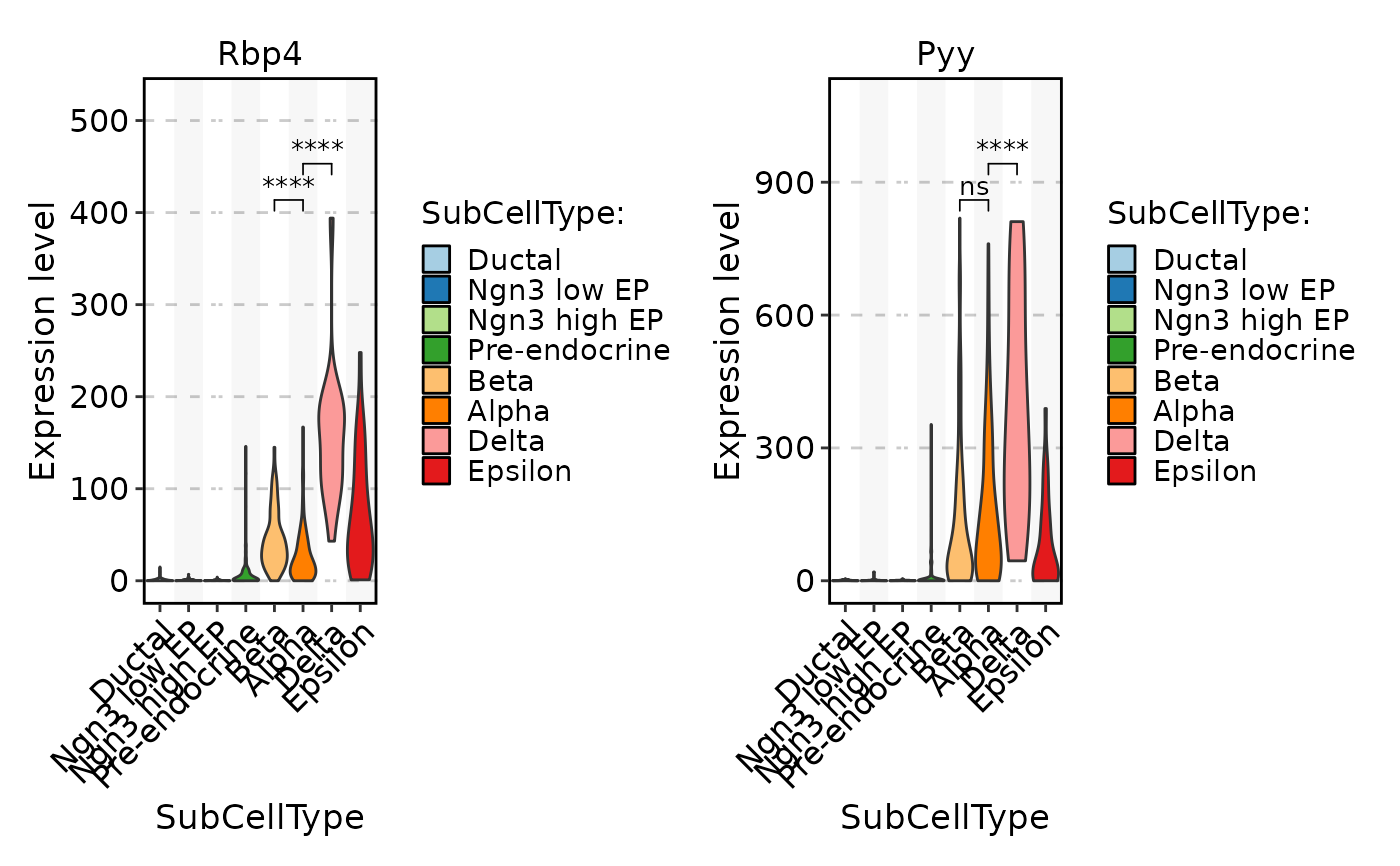
 FeatureStatPlot(pancreas_sub, stat.by = c("Rbp4", "Pyy"), group.by = "SubCellType", comparisons = list(c("Alpha", "Beta"), c("Alpha", "Delta")))
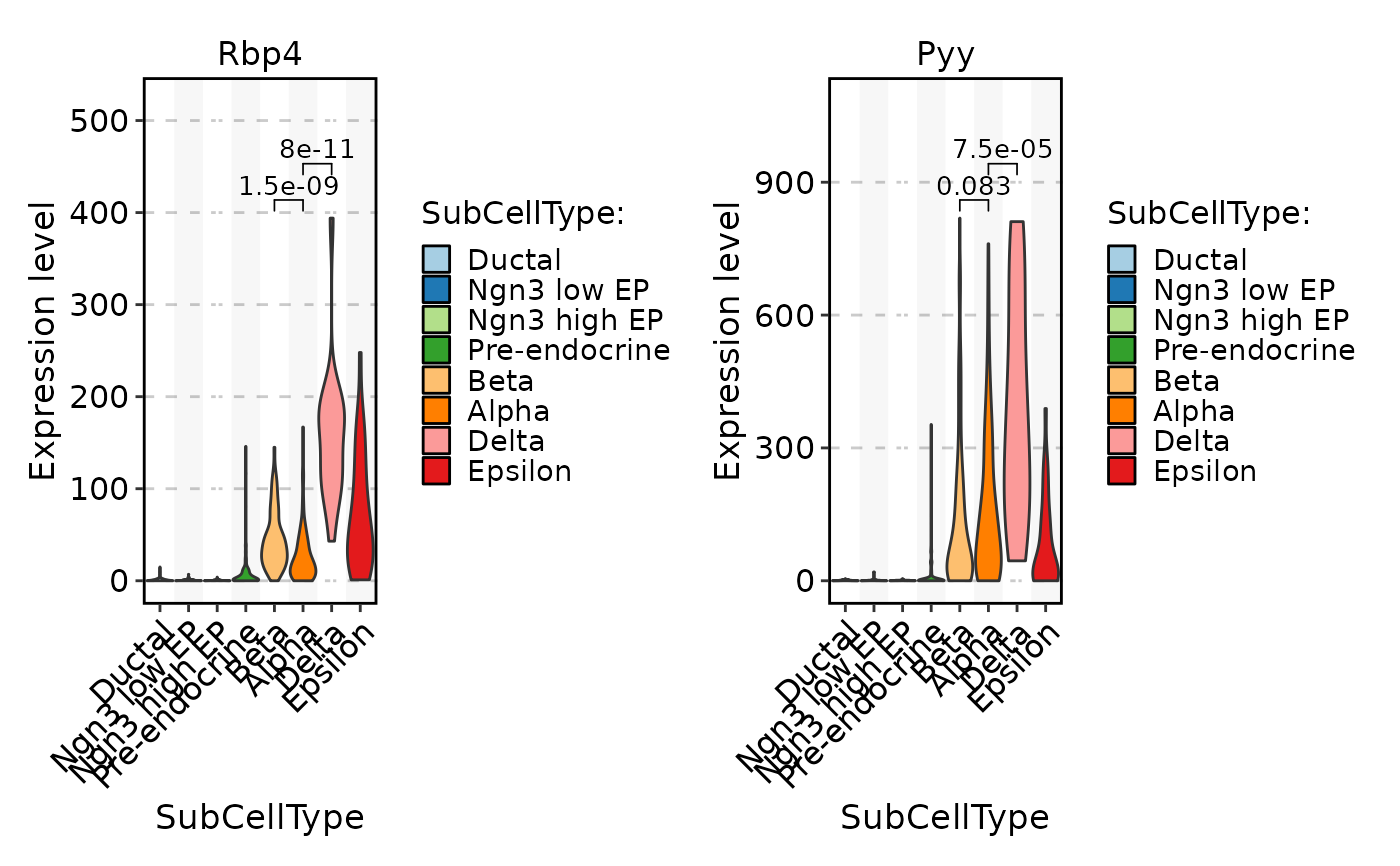
 FeatureStatPlot(pancreas_sub, stat.by = c("Rbp4", "Pyy"), group.by = "SubCellType", comparisons = list(c("Alpha", "Beta"), c("Alpha", "Delta")), sig_label = "p.format")
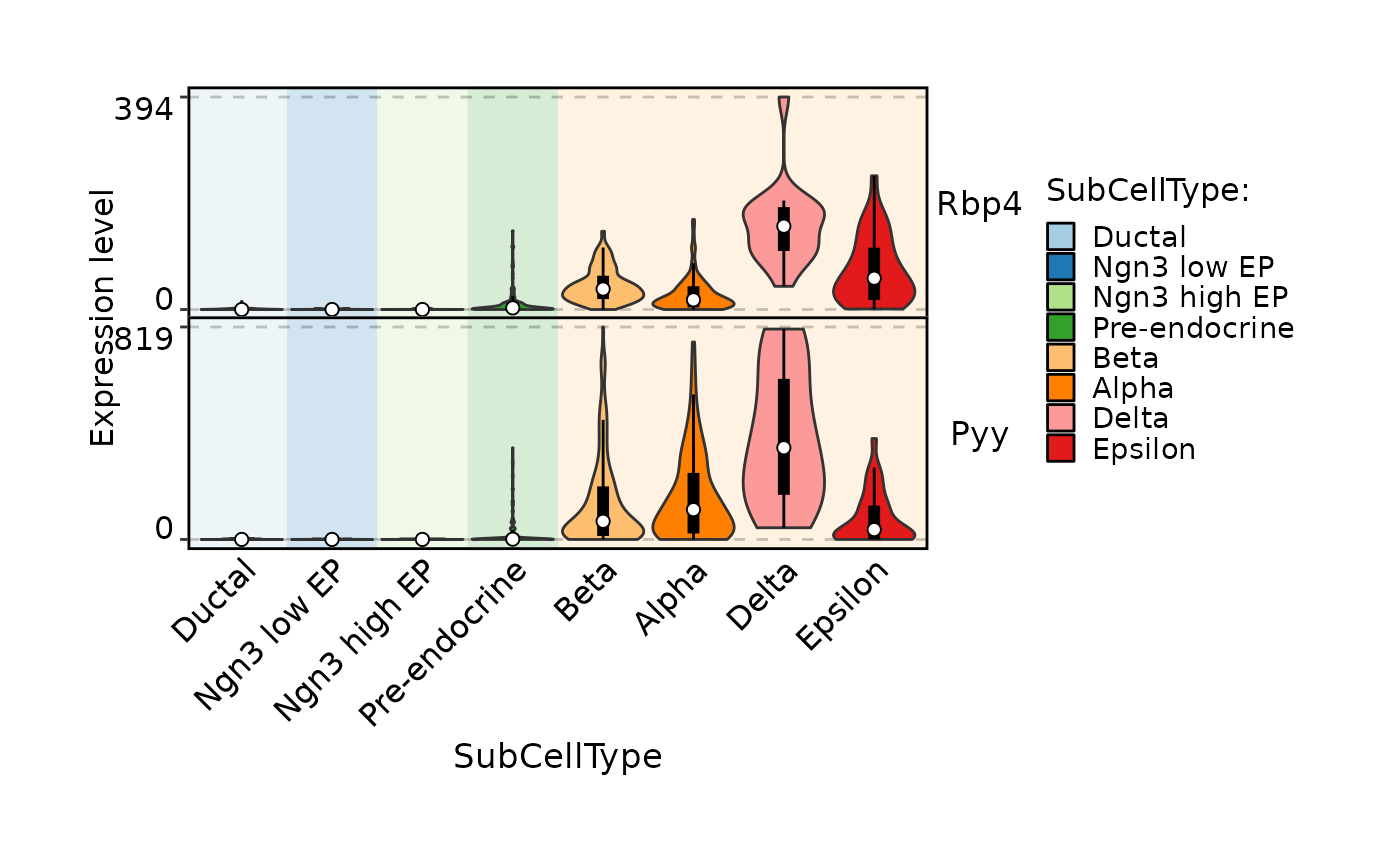
 FeatureStatPlot(pancreas_sub, stat.by = c("Rbp4", "Pyy"), group.by = "SubCellType", bg.by = "CellType", add_box = TRUE, stack = TRUE)
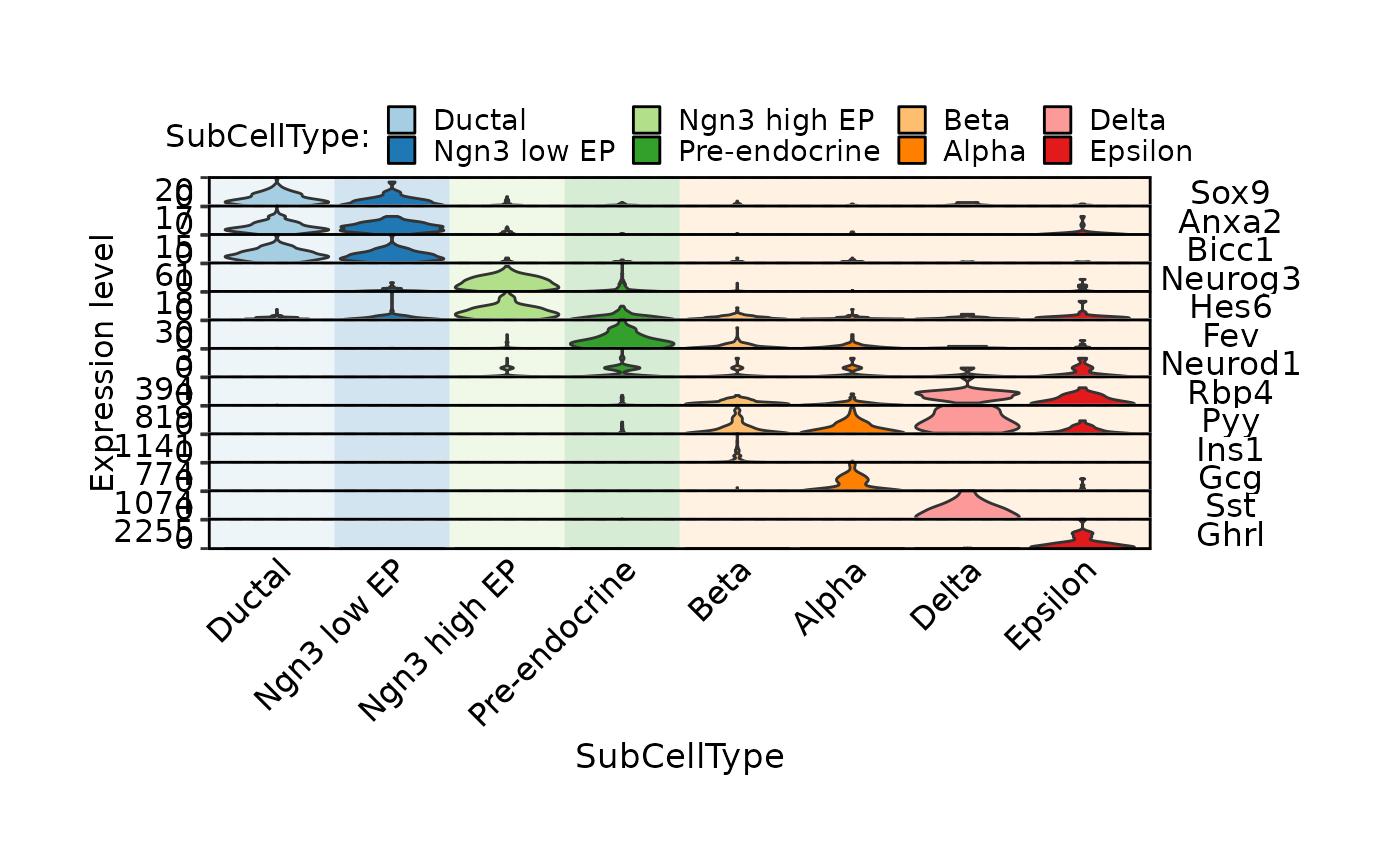
 FeatureStatPlot(pancreas_sub,
stat.by = c(
"Sox9", "Anxa2", "Bicc1", # Ductal
"Neurog3", "Hes6", # EPs
"Fev", "Neurod1", # Pre-endocrine
"Rbp4", "Pyy", # Endocrine
"Ins1", "Gcg", "Sst", "Ghrl" # Beta, Alpha, Delta, Epsilon
),
legend.position = "top", legend.direction = "horizontal",
group.by = "SubCellType", bg.by = "CellType", stack = TRUE
)
FeatureStatPlot(pancreas_sub,
stat.by = c(
"Sox9", "Anxa2", "Bicc1", # Ductal
"Neurog3", "Hes6", # EPs
"Fev", "Neurod1", # Pre-endocrine
"Rbp4", "Pyy", # Endocrine
"Ins1", "Gcg", "Sst", "Ghrl" # Beta, Alpha, Delta, Epsilon
),
legend.position = "top", legend.direction = "horizontal",
group.by = "SubCellType", bg.by = "CellType", stack = TRUE
)
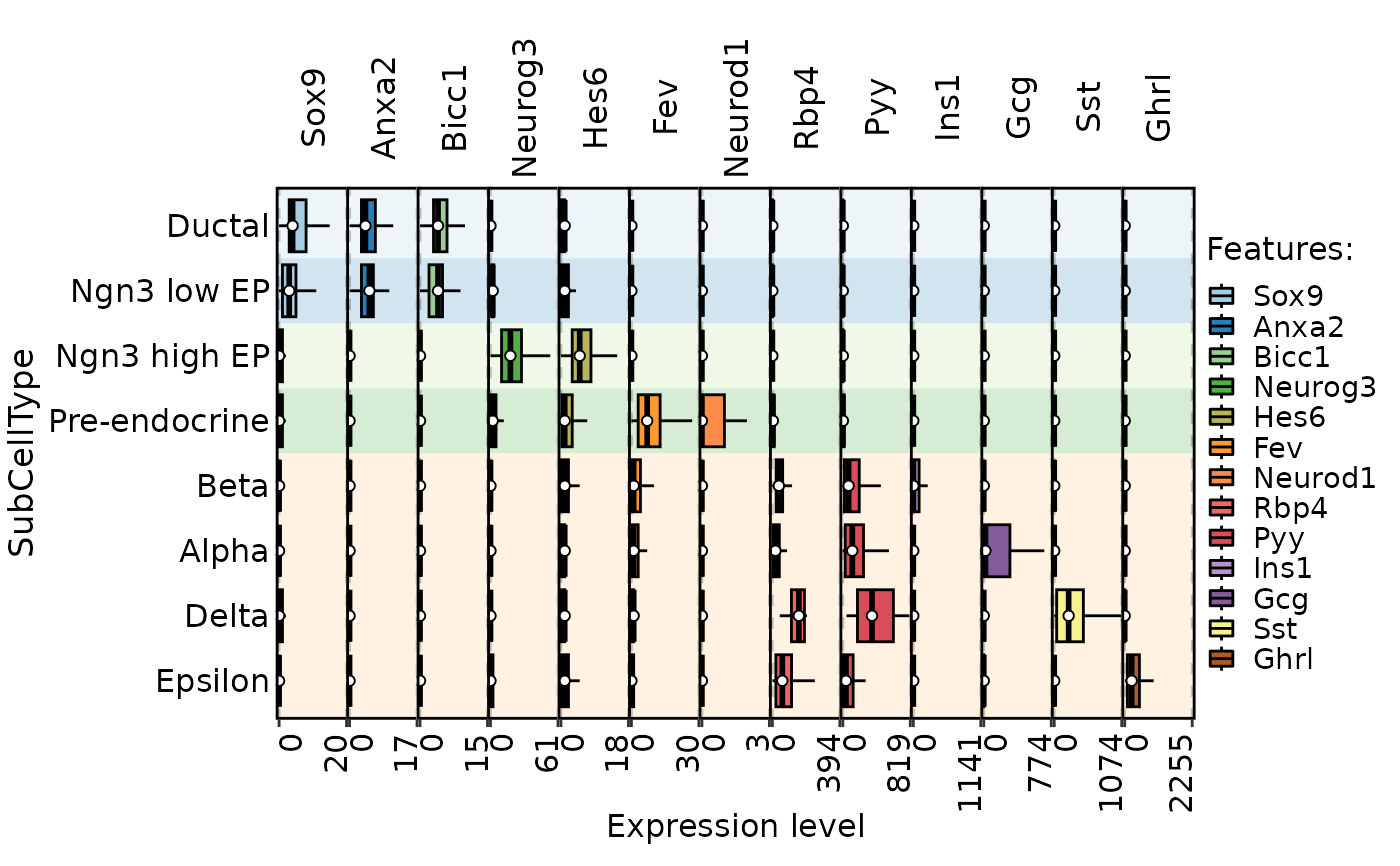
 FeatureStatPlot(pancreas_sub,
stat.by = c(
"Sox9", "Anxa2", "Bicc1", # Ductal
"Neurog3", "Hes6", # EPs
"Fev", "Neurod1", # Pre-endocrine
"Rbp4", "Pyy", # Endocrine
"Ins1", "Gcg", "Sst", "Ghrl" # Beta, Alpha, Delta, Epsilon
),
fill.by = "feature", plot_type = "box",
group.by = "SubCellType", bg.by = "CellType", stack = TRUE, flip = TRUE
) %>% panel_fix_overall(width = 8, height = 5) # As the plot is created by combining, we can adjust the overall height and width directly.
FeatureStatPlot(pancreas_sub,
stat.by = c(
"Sox9", "Anxa2", "Bicc1", # Ductal
"Neurog3", "Hes6", # EPs
"Fev", "Neurod1", # Pre-endocrine
"Rbp4", "Pyy", # Endocrine
"Ins1", "Gcg", "Sst", "Ghrl" # Beta, Alpha, Delta, Epsilon
),
fill.by = "feature", plot_type = "box",
group.by = "SubCellType", bg.by = "CellType", stack = TRUE, flip = TRUE
) %>% panel_fix_overall(width = 8, height = 5) # As the plot is created by combining, we can adjust the overall height and width directly.
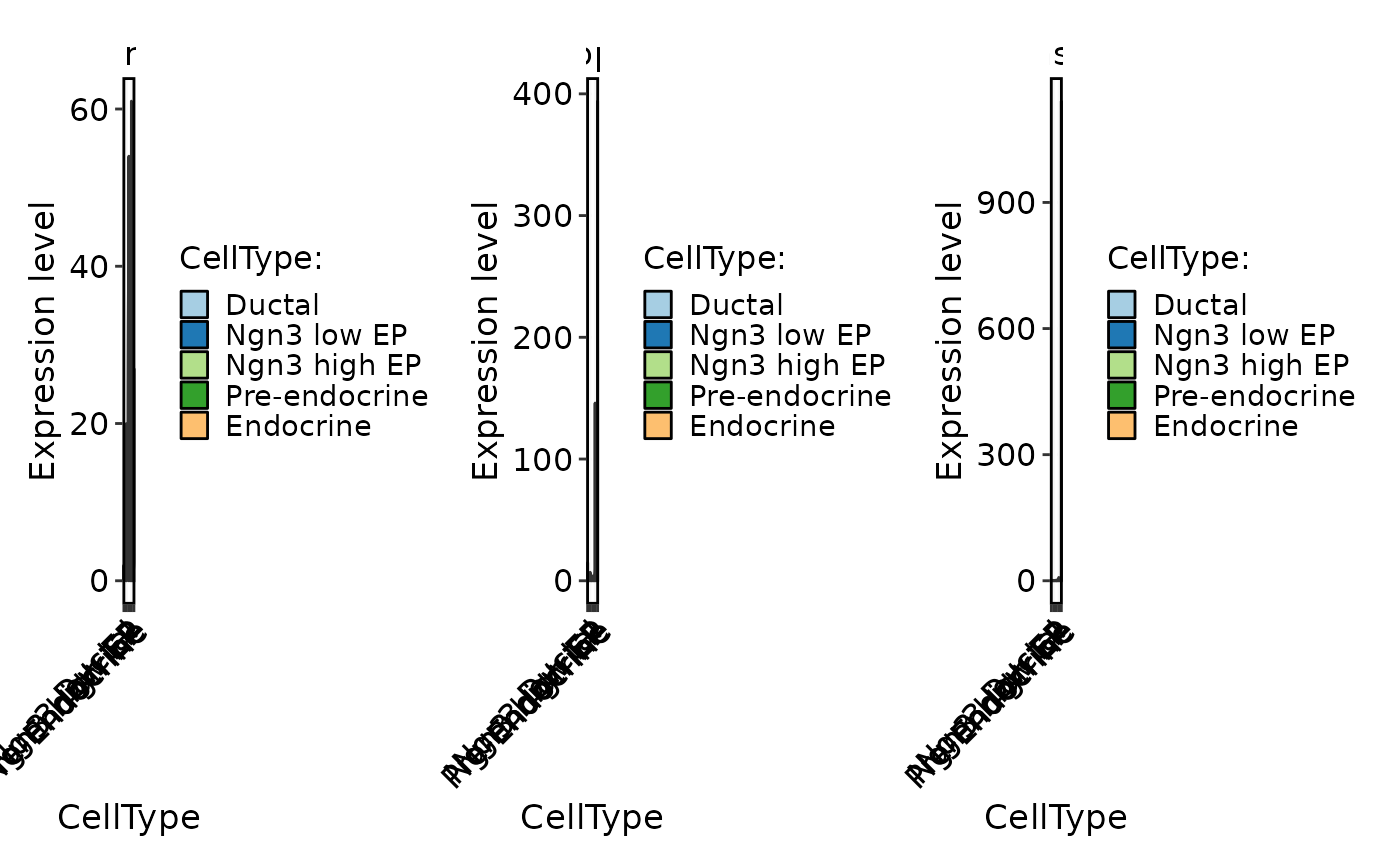
 FeatureStatPlot(pancreas_sub, stat.by = c("Neurog3", "Rbp4", "Ins1"), group.by = "CellType", plot.by = "group")
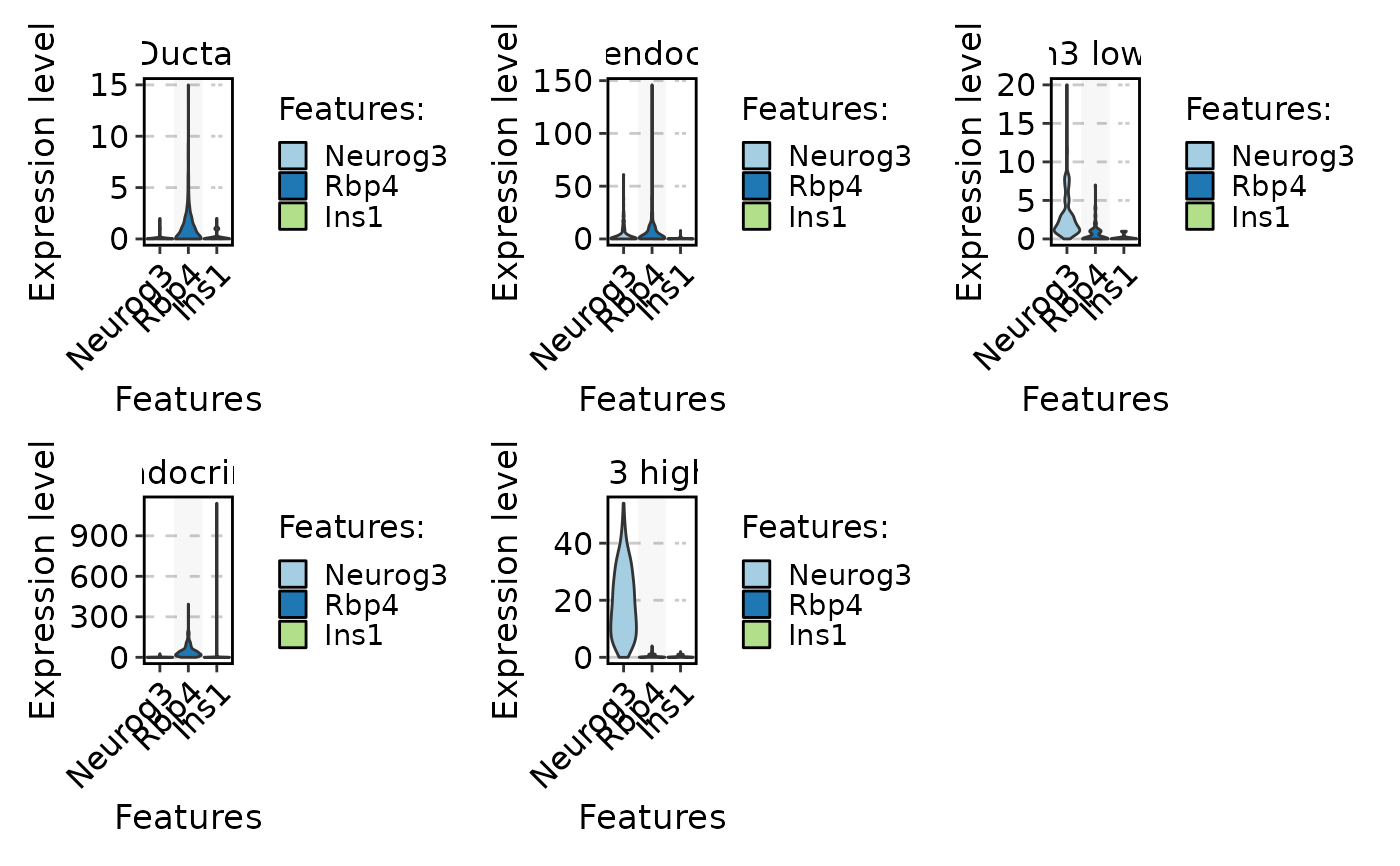
 FeatureStatPlot(pancreas_sub, stat.by = c("Neurog3", "Rbp4", "Ins1"), group.by = "CellType", plot.by = "feature")
#> Setting 'group.by' to 'Features' as 'plot.by' is set to 'feature'
FeatureStatPlot(pancreas_sub, stat.by = c("Neurog3", "Rbp4", "Ins1"), group.by = "CellType", plot.by = "feature")
#> Setting 'group.by' to 'Features' as 'plot.by' is set to 'feature'
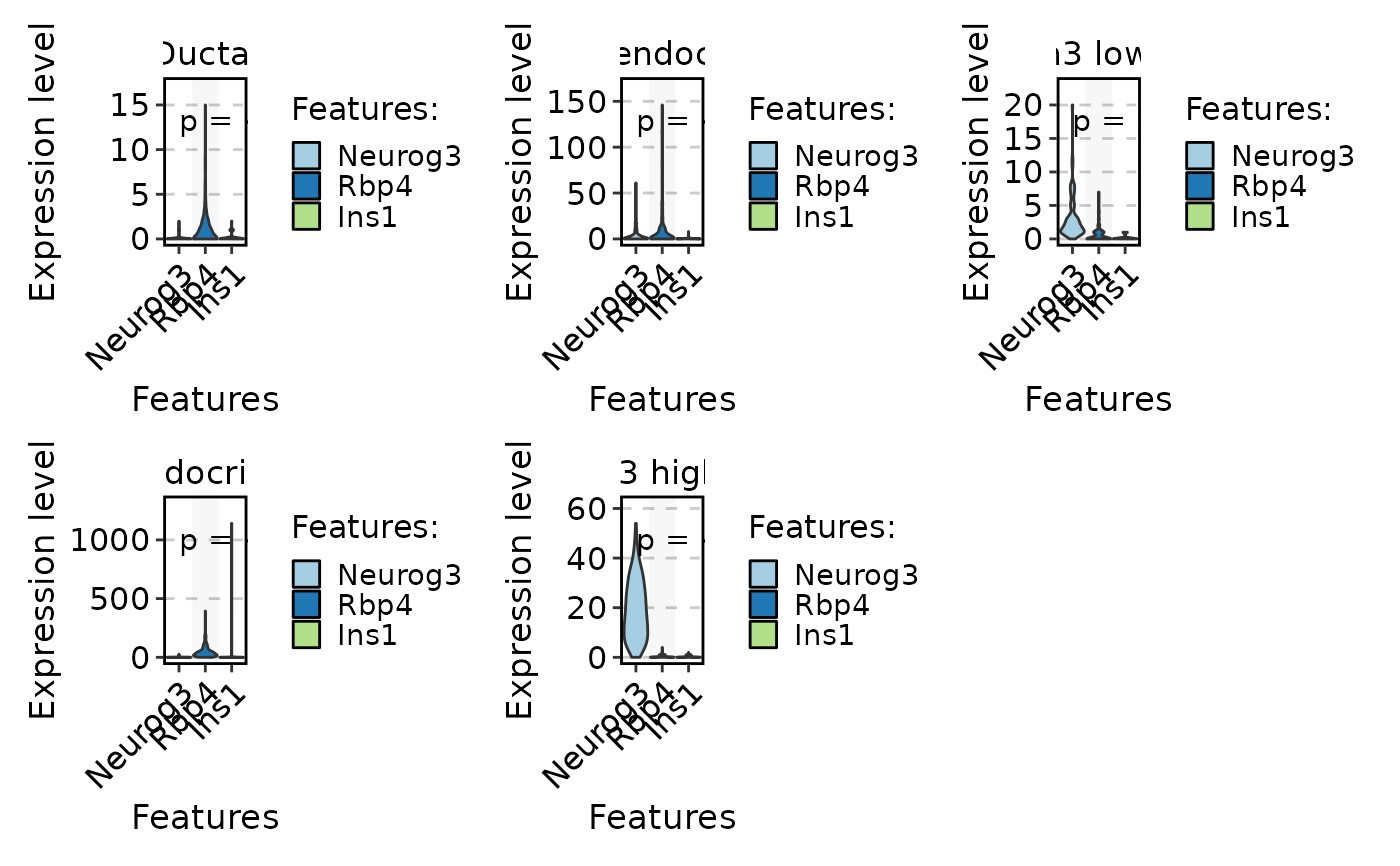
 FeatureStatPlot(pancreas_sub,
stat.by = c("Neurog3", "Rbp4", "Ins1"), group.by = "CellType", plot.by = "feature",
multiplegroup_comparisons = TRUE, sig_label = "p.format", sig_labelsize = 4
)
#> Setting 'group.by' to 'Features' as 'plot.by' is set to 'feature'
FeatureStatPlot(pancreas_sub,
stat.by = c("Neurog3", "Rbp4", "Ins1"), group.by = "CellType", plot.by = "feature",
multiplegroup_comparisons = TRUE, sig_label = "p.format", sig_labelsize = 4
)
#> Setting 'group.by' to 'Features' as 'plot.by' is set to 'feature'
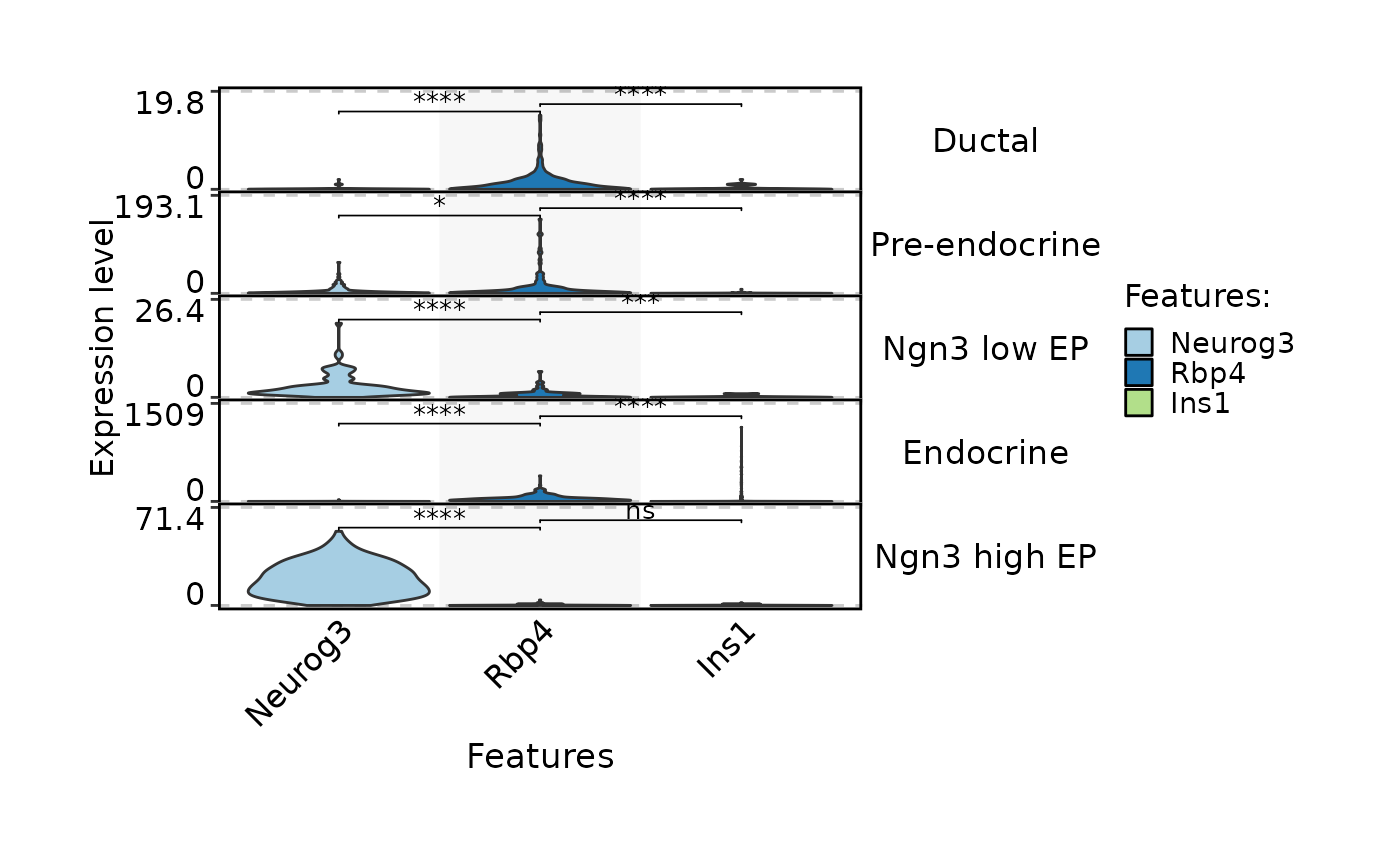
 FeatureStatPlot(pancreas_sub,
stat.by = c("Neurog3", "Rbp4", "Ins1"), group.by = "CellType", plot.by = "feature",
comparisons = list(c("Neurog3", "Rbp4"), c("Rbp4", "Ins1")),
stack = TRUE
)
#> Setting 'group.by' to 'Features' as 'plot.by' is set to 'feature'
FeatureStatPlot(pancreas_sub,
stat.by = c("Neurog3", "Rbp4", "Ins1"), group.by = "CellType", plot.by = "feature",
comparisons = list(c("Neurog3", "Rbp4"), c("Rbp4", "Ins1")),
stack = TRUE
)
#> Setting 'group.by' to 'Features' as 'plot.by' is set to 'feature'
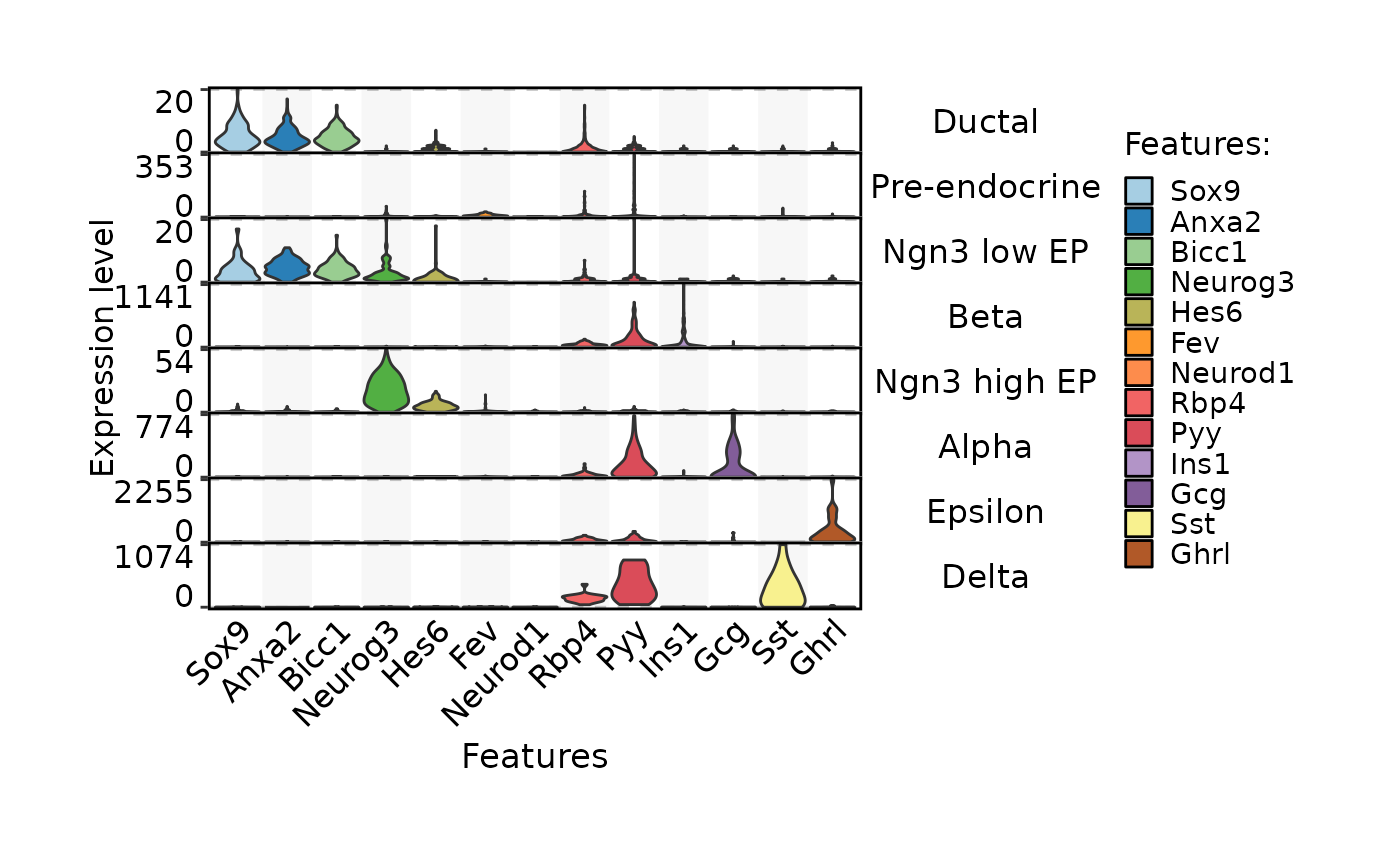
 FeatureStatPlot(pancreas_sub, stat.by = c(
"Sox9", "Anxa2", "Bicc1", # Ductal
"Neurog3", "Hes6", # EPs
"Fev", "Neurod1", # Pre-endocrine
"Rbp4", "Pyy", # Endocrine
"Ins1", "Gcg", "Sst", "Ghrl" # Beta, Alpha, Delta, Epsilon
), group.by = "SubCellType", plot.by = "feature", stack = TRUE)
#> Setting 'group.by' to 'Features' as 'plot.by' is set to 'feature'
FeatureStatPlot(pancreas_sub, stat.by = c(
"Sox9", "Anxa2", "Bicc1", # Ductal
"Neurog3", "Hes6", # EPs
"Fev", "Neurod1", # Pre-endocrine
"Rbp4", "Pyy", # Endocrine
"Ins1", "Gcg", "Sst", "Ghrl" # Beta, Alpha, Delta, Epsilon
), group.by = "SubCellType", plot.by = "feature", stack = TRUE)
#> Setting 'group.by' to 'Features' as 'plot.by' is set to 'feature'
 library(Matrix)
#>
#> Attaching package: ‘Matrix’
#> The following object is masked from ‘package:S4Vectors’:
#>
#> expand
data <- pancreas_sub@assays$RNA@data
pancreas_sub@assays$RNA@scale.data <- as_matrix(data / rowMeans(data))
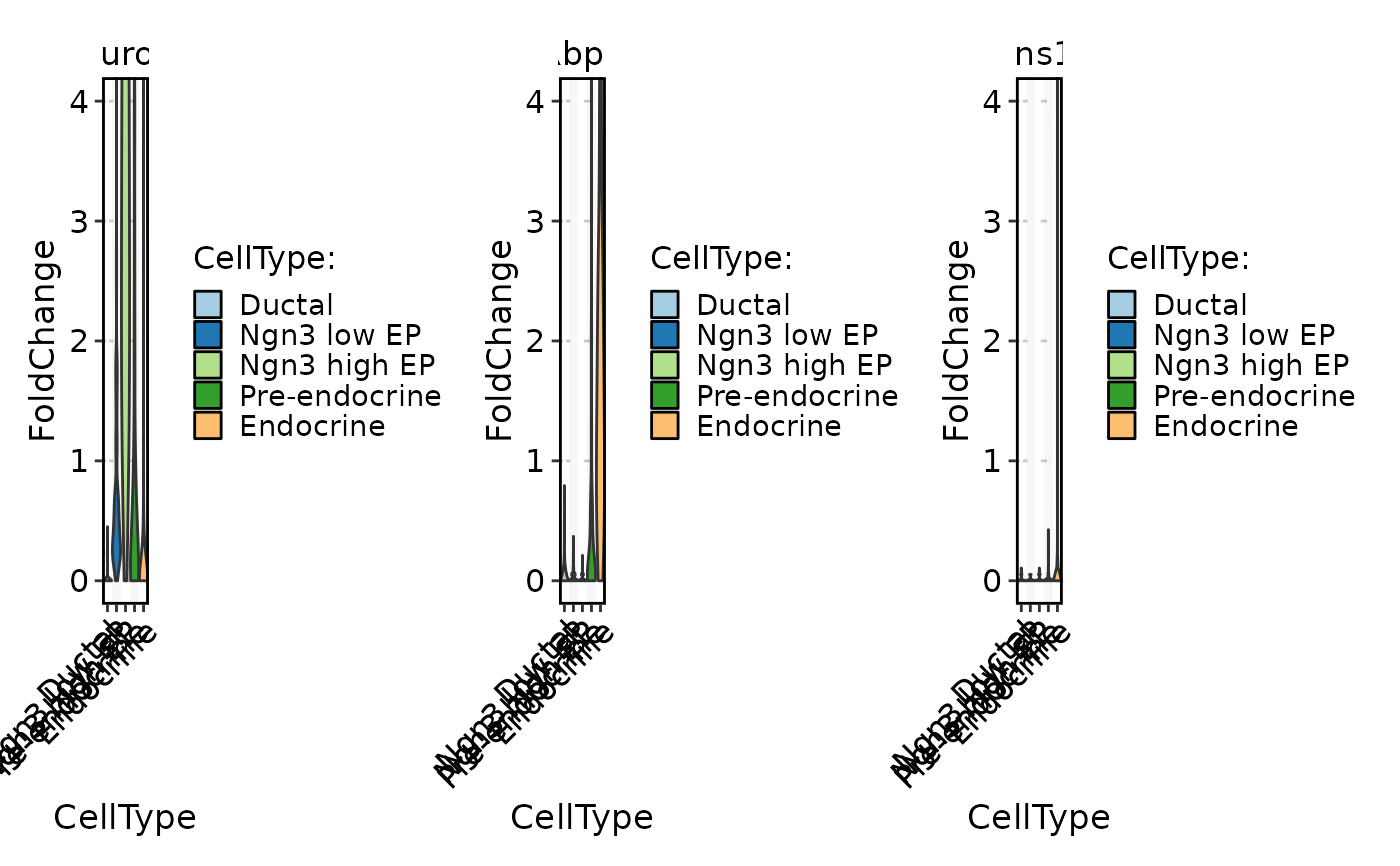
FeatureStatPlot(pancreas_sub,
stat.by = c("Neurog3", "Rbp4", "Ins1"), group.by = "CellType",
slot = "scale.data", ylab = "FoldChange", same.y.lims = TRUE, y.max = 4
)
library(Matrix)
#>
#> Attaching package: ‘Matrix’
#> The following object is masked from ‘package:S4Vectors’:
#>
#> expand
data <- pancreas_sub@assays$RNA@data
pancreas_sub@assays$RNA@scale.data <- as_matrix(data / rowMeans(data))
FeatureStatPlot(pancreas_sub,
stat.by = c("Neurog3", "Rbp4", "Ins1"), group.by = "CellType",
slot = "scale.data", ylab = "FoldChange", same.y.lims = TRUE, y.max = 4
)