This function utilizes the Seurat package to perform a differential expression (DE) test on gene expression data. Users have the flexibility to specify custom cell groups, marker types, and various options for DE analysis.
Usage
RunDEtest(
  srt,
  group_by = NULL,
  group1 = NULL,
  group2 = NULL,
  cells1 = NULL,
  cells2 = NULL,
  features = NULL,
  markers_type = c("all", "paired", "conserved", "disturbed"),
  grouping.var = NULL,
  meta.method = c("maximump", "minimump", "wilkinsonp", "meanp", "sump", "votep"),
  test.use = "wilcox",
  only.pos = TRUE,
  fc.threshold = 1.5,
  base = 2,
  pseudocount.use = 1,
  mean.fxn = NULL,
  min.pct = 0.1,
  min.diff.pct = -Inf,
  max.cells.per.ident = Inf,
  latent.vars = NULL,
  min.cells.feature = 3,
  min.cells.group = 3,
  norm.method = "LogNormalize",
  p.adjust.method = "bonferroni",
  slot = "data",
  assay = NULL,
  BPPARAM = BiocParallel::bpparam(),
  seed = 11,
  verbose = TRUE,
  ...
)
Arguments
- srt
A Seurat object.
- group_by
A grouping variable in the dataset to define the groups or conditions for the differential test. If not provided, the function uses the "active.ident" variable in the Seurat object.
- group1
A vector of cell IDs or a character vector specifying the cells that belong to the first group. If both group_by and group1 are provided, group1 takes precedence.
- group2
A vector of cell IDs or a character vector specifying the cells that belong to the second group. This parameter is only used when group_by or group1 is provided.
- cells1
A vector of cell IDs specifying the cells that belong to group1. If provided, group1 is ignored.
- cells2
A vector of cell IDs specifying the cells that belong to group2. This parameter is only used when cells1 is provided.
- features
A vector of gene names specifying the features to consider for the differential test. If not provided, all features in the dataset are considered.
- markers_type
A character value specifying the type of markers to find. Possible values are "all", "paired", "conserved", and "disturbed".
- grouping.var
A character value specifying the grouping variable for finding conserved or disturbed markers. This parameter is only used when markers_type is "conserved" or "disturbed".
- meta.method
A character value specifying the method to use for combining p-values in the conserved markers test. Possible values are "maximump", "minimump", "wilkinsonp", "meanp", "sump", and "votep".
- test.use
Denotes which test to use. Available options are:
"wilcox" : Identifies differentially expressed genes between two groups of cells using a Wilcoxon Rank Sum test (default)
"bimod" : Likelihood-ratio test for single cell gene expression, (McDavid et al., Bioinformatics, 2013)
"roc" : Identifies 'markers' of gene expression using ROC analysis. For each gene, evaluates (using AUC) a classifier built on that gene alone, to classify between two groups of cells. An AUC value of 1 means that expression values for this gene alone can perfectly classify the two groupings (i.e. Each of the cells in cells.1 exhibit a higher level than each of the cells in cells.2). An AUC value of 0 also means there is perfect classification, but in the other direction. A value of 0.5 implies that the gene has no predictive power to classify the two groups. Returns a 'predictive power' (abs(AUC-0.5) * 2) ranked matrix of putative differentially expressed genes.
"t" : Identify differentially expressed genes between two groups of cells using the Student's t-test.
"negbinom" : Identifies differentially expressed genes between two groups of cells using a negative binomial generalized linear model. Use only for UMI-based datasets
"poisson" : Identifies differentially expressed genes between two groups of cells using a poisson generalized linear model. Use only for UMI-based datasets
"LR" : Uses a logistic regression framework to determine differentially expressed genes. Constructs a logistic regression model predicting group membership based on each feature individually and compares this to a null model with a likelihood ratio test.
"MAST" : Identifies differentially expressed genes between two groups of cells using a hurdle model tailored to scRNA-seq data. Utilizes the MAST package to run the DE testing.
"DESeq2" : Identifies differentially expressed genes between two groups of cells based on a model using DESeq2 which uses a negative binomial distribution (Love et al, Genome Biology, 2014).This test does not support pre-filtering of genes based on average difference (or percent detection rate) between cell groups. However, genes may be pre-filtered based on their minimum detection rate (min.pct) across both cell groups. To use this method, please install DESeq2, using the instructions at https://bioconductor.org/packages/release/bioc/html/DESeq2.html
- only.pos
Only return positive markers (FALSE by default)
- fc.threshold
A numeric value used to filter genes for testing based on their average fold change between/among the two groups. By default, it is set to 1.5
- base
The base with respect to which logarithms are computed.
- pseudocount.use
Pseudocount to add to averaged expression values when calculating logFC. 1 by default.
- mean.fxn
Function to use for fold change or average difference calculation. If NULL, the appropriate function will be chose according to the slot used
- min.pct
only test genes that are detected in a minimum fraction of min.pct cells in either of the two populations. Meant to speed up the function by not testing genes that are very infrequently expressed. Default is 0.1
- min.diff.pct
only test genes that show a minimum difference in the fraction of detection between the two groups. Set to -Inf by default
- max.cells.per.ident
Down sample each identity class to a max number. Default is no downsampling. Not activated by default (set to Inf)
- latent.vars
Variables to test, used only when
test.useis one of 'LR', 'negbinom', 'poisson', or 'MAST'- min.cells.feature
Minimum number of cells expressing the feature in at least one of the two groups, currently only used for poisson and negative binomial tests
- min.cells.group
Minimum number of cells in one of the groups
- norm.method
Normalization method for fold change calculation when slot is 'data'. Default is "LogNormalize".
- p.adjust.method
A character value specifying the method to use for adjusting p-values. Default is "bonferroni".
- slot
Slot to pull data from; note that if
test.useis "negbinom", "poisson", or "DESeq2",slotwill be set to "counts"- assay
Assay to use in differential expression testing
- BPPARAM
A BiocParallelParam object specifying the parallelization parameters for the differential test. Default is BiocParallel::bpparam().
- seed
An integer value specifying the seed. Default is 11.
- verbose
A logical value indicating whether to display progress messages during the differential test. Default is TRUE.
- ...
Additional arguments to pass to the
FindMarkersfunction.
Examples
library(dplyr)
data("pancreas_sub")
pancreas_sub <- RunDEtest(pancreas_sub, group_by = "SubCellType")
#> Warning: Data in the 'data' slot is raw counts. Perform NormalizeData(LogNormalize) on the data.
#> [2023-11-21 07:26:34.241169] Start DEtest
#> Workers: 2
#> Find all markers(wilcox) among 8 groups...
#>
|
| | 0%
#>
#>
#>
#>
#>
|
|======================================================= | 50%
#>
#>
#>
#>
#>
|
|==============================================================================================================| 100%
#>
#> [2023-11-21 07:26:49.238309] DEtest done
#> Elapsed time:15 secs
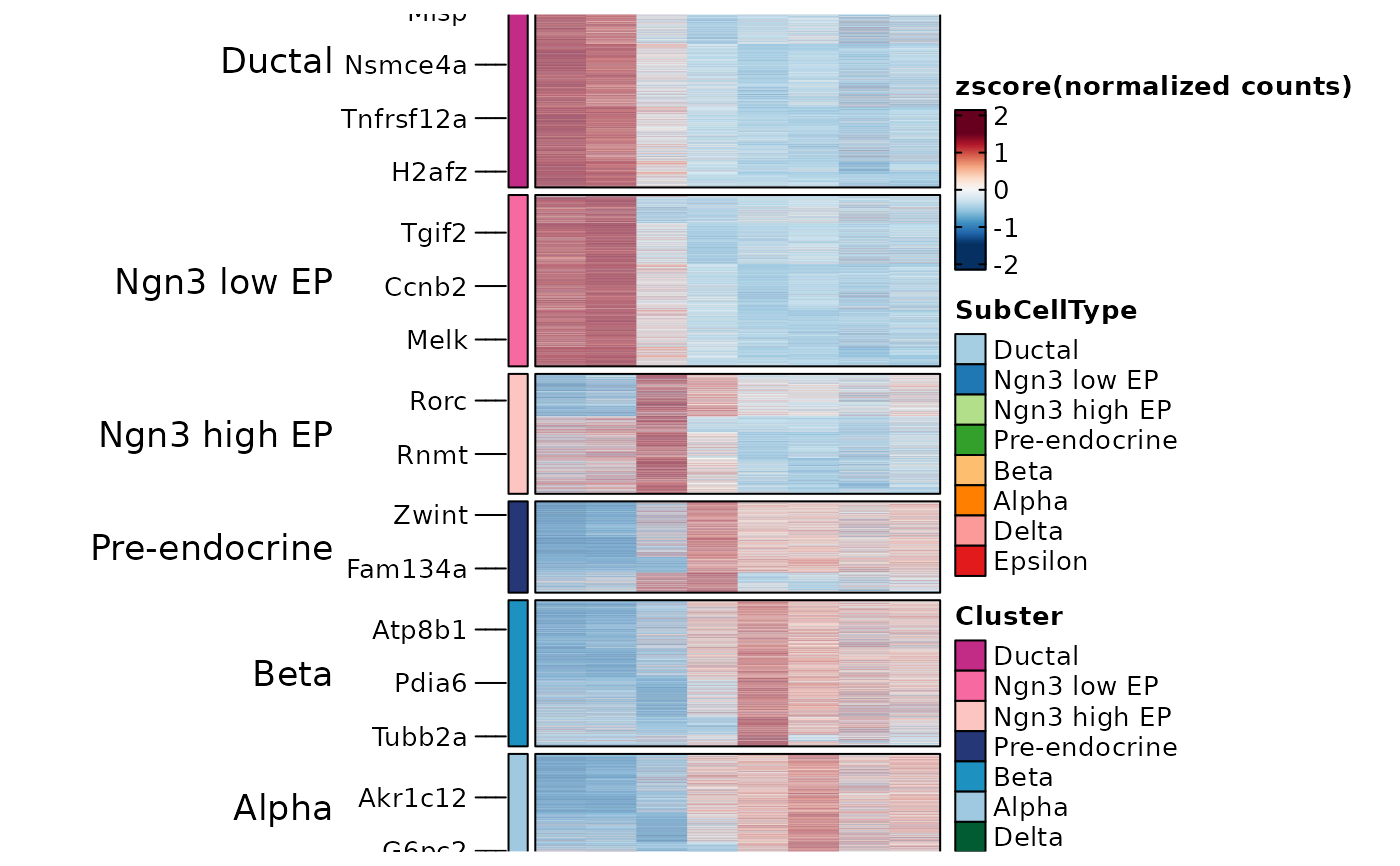
AllMarkers <- filter(pancreas_sub@tools$DEtest_SubCellType$AllMarkers_wilcox, p_val_adj < 0.05 & avg_log2FC > 1)
table(AllMarkers$group1)
#>
#> Ductal Ngn3 low EP Ngn3 high EP Pre-endocrine Beta Alpha Delta Epsilon
#> 1098 363 381 212 458 273 130 158
ht1 <- GroupHeatmap(pancreas_sub, features = AllMarkers$gene, feature_split = AllMarkers$group1, group.by = "SubCellType")
#> 'magick' package is suggested to install to give better rasterization.
#>
#> Set `ht_opt$message = FALSE` to turn off this message.
#>
#> The size of the heatmap is fixed because certain elements are not scalable.
#> The width and height of the heatmap are determined by the size of the current viewport.
#> If you want to have more control over the size, you can manually set the parameters 'width' and 'height'.
ht1$plot
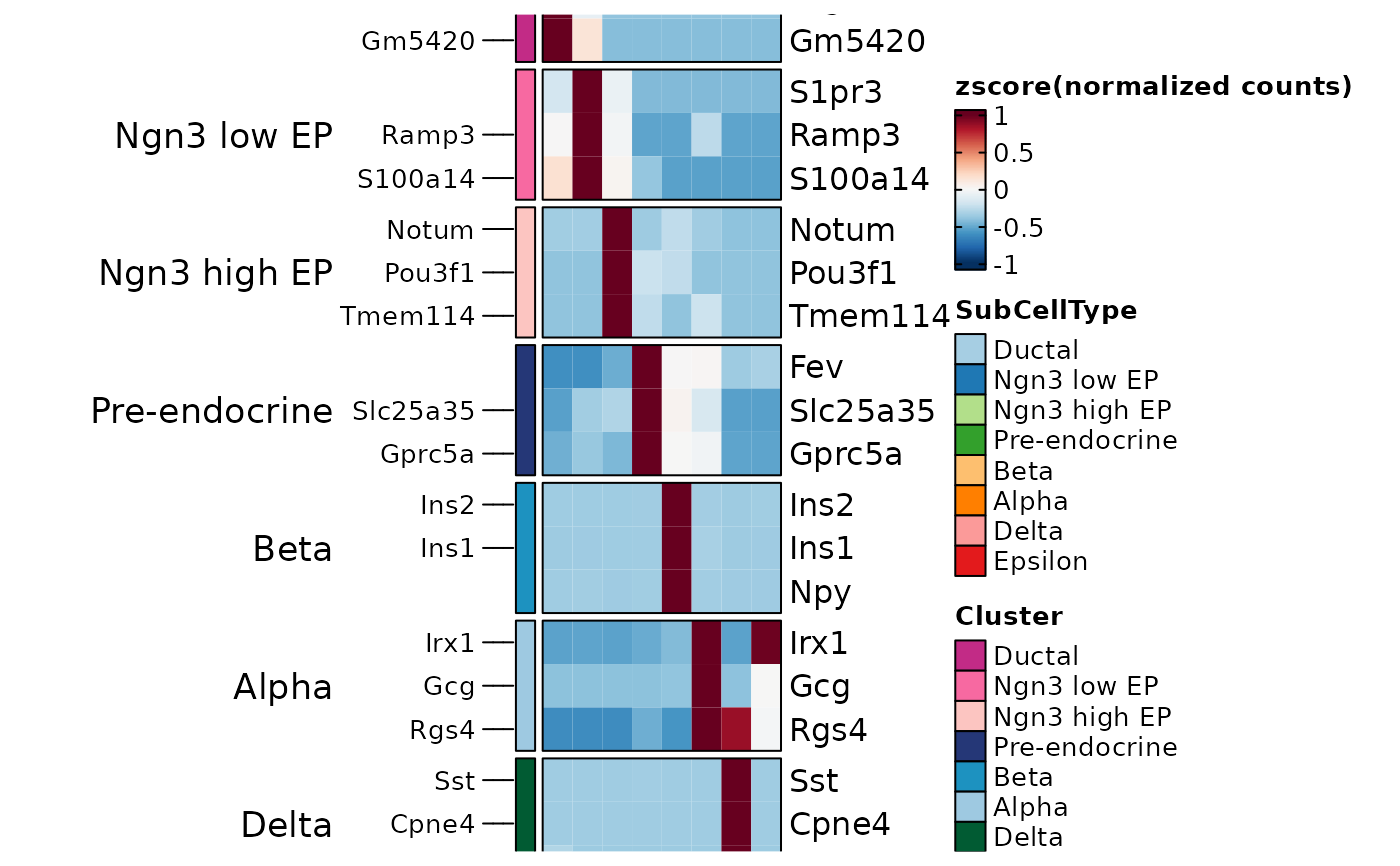
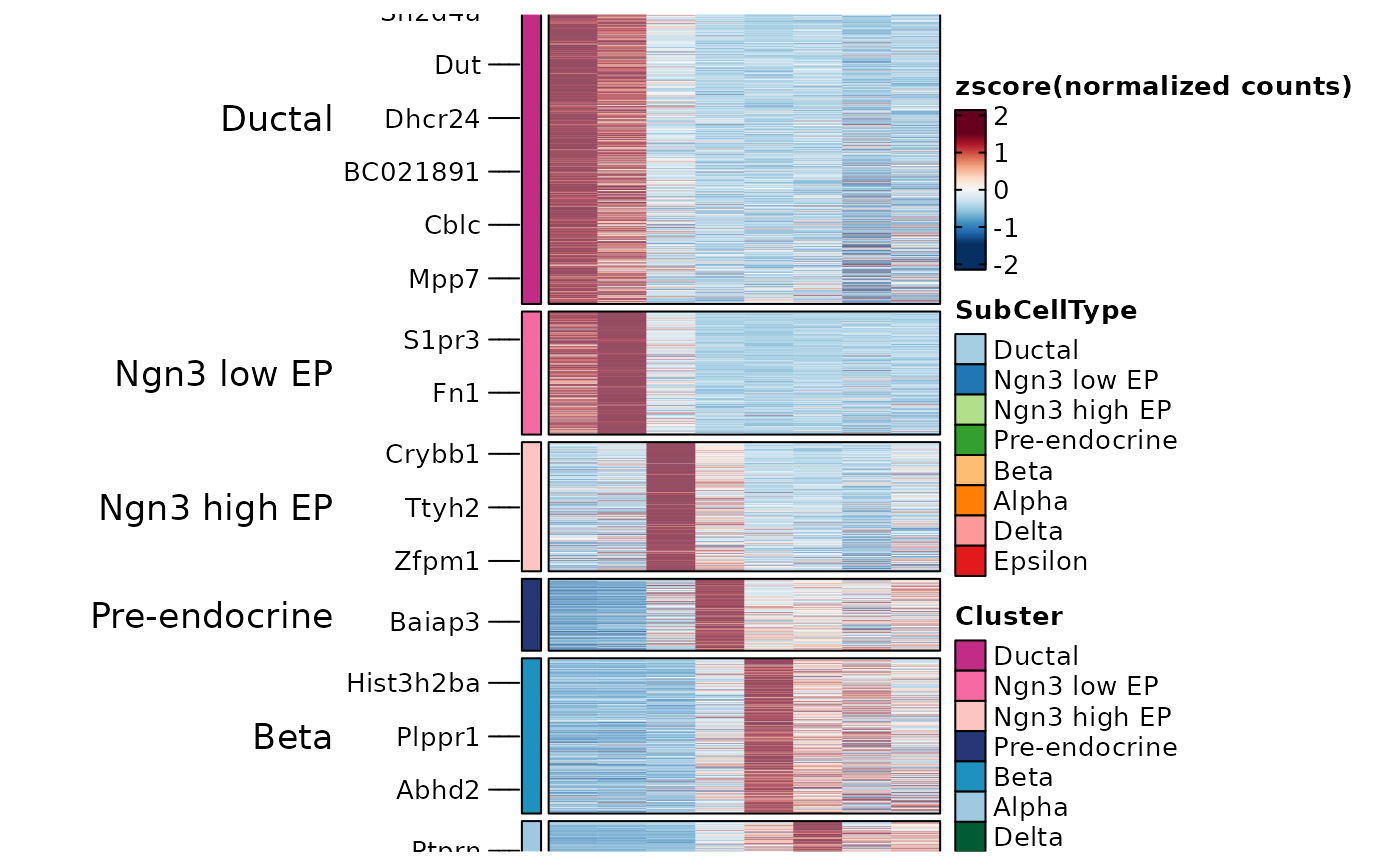 TopMarkers <- AllMarkers %>%
group_by(gene) %>%
top_n(1, avg_log2FC) %>%
group_by(group1) %>%
top_n(3, avg_log2FC)
ht2 <- GroupHeatmap(pancreas_sub, features = TopMarkers$gene, feature_split = TopMarkers$group1, group.by = "SubCellType", show_row_names = TRUE)
#> 'magick' package is suggested to install to give better rasterization.
#>
#> Set `ht_opt$message = FALSE` to turn off this message.
#>
#> The size of the heatmap is fixed because certain elements are not scalable.
#> The width and height of the heatmap are determined by the size of the current viewport.
#> If you want to have more control over the size, you can manually set the parameters 'width' and 'height'.
ht2$plot
TopMarkers <- AllMarkers %>%
group_by(gene) %>%
top_n(1, avg_log2FC) %>%
group_by(group1) %>%
top_n(3, avg_log2FC)
ht2 <- GroupHeatmap(pancreas_sub, features = TopMarkers$gene, feature_split = TopMarkers$group1, group.by = "SubCellType", show_row_names = TRUE)
#> 'magick' package is suggested to install to give better rasterization.
#>
#> Set `ht_opt$message = FALSE` to turn off this message.
#>
#> The size of the heatmap is fixed because certain elements are not scalable.
#> The width and height of the heatmap are determined by the size of the current viewport.
#> If you want to have more control over the size, you can manually set the parameters 'width' and 'height'.
ht2$plot
 pancreas_sub <- RunDEtest(pancreas_sub, group_by = "SubCellType", markers_type = "paired")
#> [2023-11-21 07:26:55.204795] Start DEtest
#> Workers: 2
#> Find paired markers(wilcox) among 8 groups...
#>
|
| | 0%
#>
#>
#>
#>
#>
#>
#>
#>
#>
#>
#>
#>
#>
#>
#>
#>
#>
#>
#>
#>
#>
#>
#>
#>
#>
#>
#>
#>
#>
|
|======================================================= | 50%
#>
#>
#>
#>
#>
#>
#>
#>
#>
#>
#>
#>
#>
#>
#>
#>
#>
#>
#>
#>
#>
#>
#>
#>
#>
#>
#>
#>
#>
|
|==============================================================================================================| 100%
#>
#> [2023-11-21 07:27:49.541489] DEtest done
#> Elapsed time:54.34 secs
PairedMarkers <- filter(pancreas_sub@tools$DEtest_SubCellType$PairedMarkers_wilcox, p_val_adj < 0.05 & avg_log2FC > 1)
table(PairedMarkers$group1)
#>
#> Ductal Ngn3 low EP Ngn3 high EP Pre-endocrine Beta Alpha Delta Epsilon
#> 4476 2999 2099 1598 2558 1850 1182 1473
ht3 <- GroupHeatmap(pancreas_sub, features = PairedMarkers$gene, feature_split = PairedMarkers$group1, group.by = "SubCellType")
#> 'magick' package is suggested to install to give better rasterization.
#>
#> Set `ht_opt$message = FALSE` to turn off this message.
#>
#> The size of the heatmap is fixed because certain elements are not scalable.
#> The width and height of the heatmap are determined by the size of the current viewport.
#> If you want to have more control over the size, you can manually set the parameters 'width' and 'height'.
ht3$plot
pancreas_sub <- RunDEtest(pancreas_sub, group_by = "SubCellType", markers_type = "paired")
#> [2023-11-21 07:26:55.204795] Start DEtest
#> Workers: 2
#> Find paired markers(wilcox) among 8 groups...
#>
|
| | 0%
#>
#>
#>
#>
#>
#>
#>
#>
#>
#>
#>
#>
#>
#>
#>
#>
#>
#>
#>
#>
#>
#>
#>
#>
#>
#>
#>
#>
#>
|
|======================================================= | 50%
#>
#>
#>
#>
#>
#>
#>
#>
#>
#>
#>
#>
#>
#>
#>
#>
#>
#>
#>
#>
#>
#>
#>
#>
#>
#>
#>
#>
#>
|
|==============================================================================================================| 100%
#>
#> [2023-11-21 07:27:49.541489] DEtest done
#> Elapsed time:54.34 secs
PairedMarkers <- filter(pancreas_sub@tools$DEtest_SubCellType$PairedMarkers_wilcox, p_val_adj < 0.05 & avg_log2FC > 1)
table(PairedMarkers$group1)
#>
#> Ductal Ngn3 low EP Ngn3 high EP Pre-endocrine Beta Alpha Delta Epsilon
#> 4476 2999 2099 1598 2558 1850 1182 1473
ht3 <- GroupHeatmap(pancreas_sub, features = PairedMarkers$gene, feature_split = PairedMarkers$group1, group.by = "SubCellType")
#> 'magick' package is suggested to install to give better rasterization.
#>
#> Set `ht_opt$message = FALSE` to turn off this message.
#>
#> The size of the heatmap is fixed because certain elements are not scalable.
#> The width and height of the heatmap are determined by the size of the current viewport.
#> If you want to have more control over the size, you can manually set the parameters 'width' and 'height'.
ht3$plot
 data("panc8_sub")
panc8_sub <- Integration_SCP(panc8_sub, batch = "tech", integration_method = "Seurat")
#> [2023-11-21 07:28:32.11699] Start Seurat_integrate
#> [2023-11-21 07:28:32.121335] Spliting srtMerge into srtList by column tech... ...
#> [2023-11-21 07:28:32.2746] Checking srtList... ...
#> Data 1/5 of the srtList is raw_normalized_counts. Perform NormalizeData(LogNormalize) on the data ...
#> Perform FindVariableFeatures on the data 1/5 of the srtList...
#> Data 2/5 of the srtList is raw_normalized_counts. Perform NormalizeData(LogNormalize) on the data ...
#> Perform FindVariableFeatures on the data 2/5 of the srtList...
#> Data 3/5 of the srtList is raw_normalized_counts. Perform NormalizeData(LogNormalize) on the data ...
#> Perform FindVariableFeatures on the data 3/5 of the srtList...
#> Data 4/5 of the srtList is raw_counts. Perform NormalizeData(LogNormalize) on the data ...
#> Perform FindVariableFeatures on the data 4/5 of the srtList...
#> Data 5/5 of the srtList is raw_counts. Perform NormalizeData(LogNormalize) on the data ...
#> Perform FindVariableFeatures on the data 5/5 of the srtList...
#> Use the separate HVF from srtList...
#> Number of available HVF: 2000
#> [2023-11-21 07:28:34.297925] Finished checking.
#> [2023-11-21 07:28:35.085951] Perform FindIntegrationAnchors on the data...
#> [2023-11-21 07:28:53.076135] Perform integration(Seurat) on the data...
#> [2023-11-21 07:28:58.92266] Perform ScaleData on the data...
#> [2023-11-21 07:28:59.071587] Perform linear dimension reduction (pca) on the data...
#> Warning: The following arguments are not used: force.recalc
#> Warning: The following arguments are not used: force.recalc
#> [2023-11-21 07:28:59.913342] Perform FindClusters (louvain) on the data...
#> [2023-11-21 07:29:00.044658] Reorder clusters...
#> [2023-11-21 07:29:00.123422] Perform nonlinear dimension reduction (umap) on the data...
#> Non-linear dimensionality reduction(umap) using Reduction(Seuratpca, dims:1-12) as input
#> Found more than one class "dist" in cache; using the first, from namespace 'BiocGenerics'
#> Also defined by ‘spam’
#> Found more than one class "dist" in cache; using the first, from namespace 'BiocGenerics'
#> Also defined by ‘spam’
#> [2023-11-21 07:29:09.036984] Seurat_integrate done
#> Elapsed time: 36.92 secs
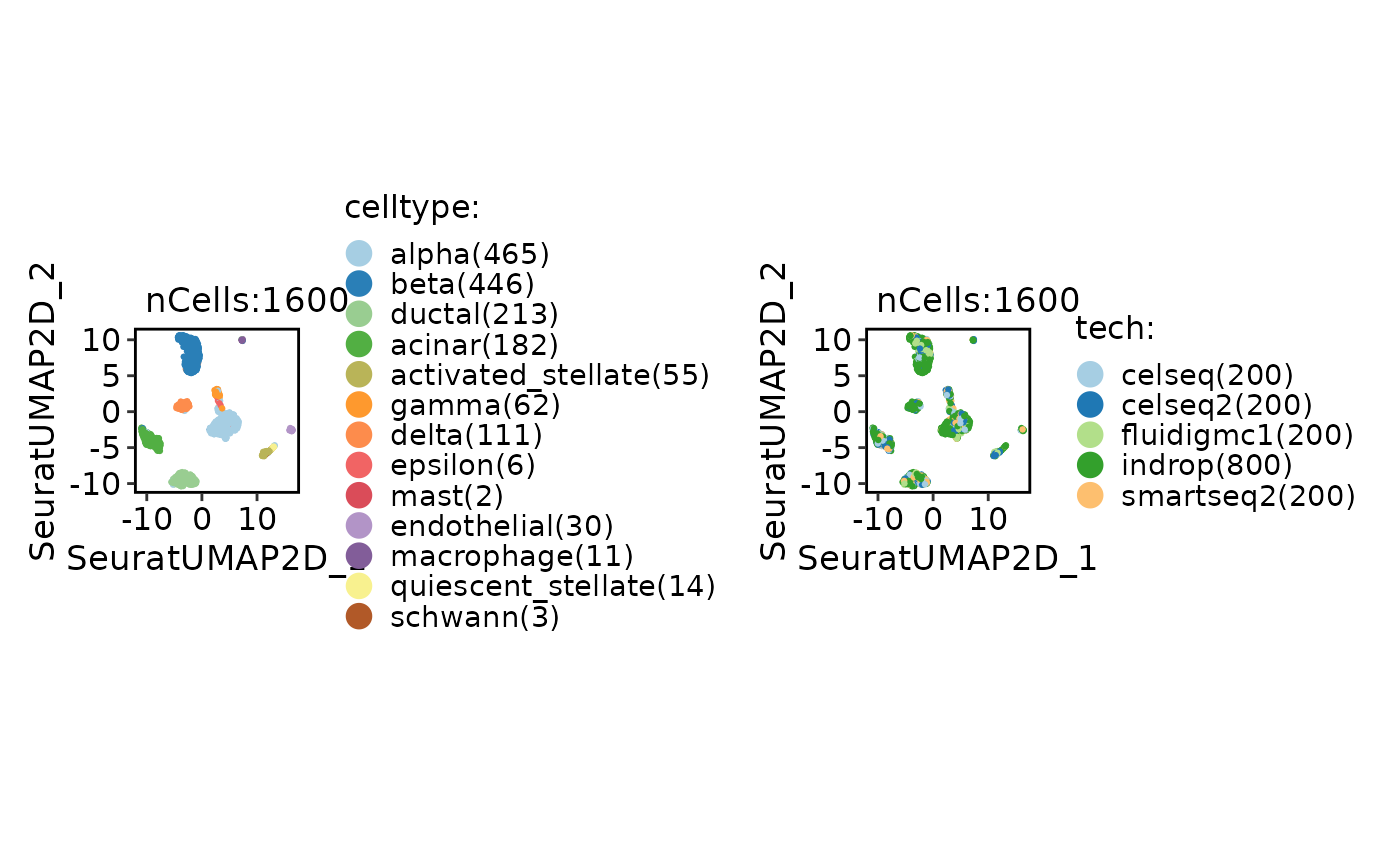
CellDimPlot(panc8_sub, group.by = c("celltype", "tech"))
data("panc8_sub")
panc8_sub <- Integration_SCP(panc8_sub, batch = "tech", integration_method = "Seurat")
#> [2023-11-21 07:28:32.11699] Start Seurat_integrate
#> [2023-11-21 07:28:32.121335] Spliting srtMerge into srtList by column tech... ...
#> [2023-11-21 07:28:32.2746] Checking srtList... ...
#> Data 1/5 of the srtList is raw_normalized_counts. Perform NormalizeData(LogNormalize) on the data ...
#> Perform FindVariableFeatures on the data 1/5 of the srtList...
#> Data 2/5 of the srtList is raw_normalized_counts. Perform NormalizeData(LogNormalize) on the data ...
#> Perform FindVariableFeatures on the data 2/5 of the srtList...
#> Data 3/5 of the srtList is raw_normalized_counts. Perform NormalizeData(LogNormalize) on the data ...
#> Perform FindVariableFeatures on the data 3/5 of the srtList...
#> Data 4/5 of the srtList is raw_counts. Perform NormalizeData(LogNormalize) on the data ...
#> Perform FindVariableFeatures on the data 4/5 of the srtList...
#> Data 5/5 of the srtList is raw_counts. Perform NormalizeData(LogNormalize) on the data ...
#> Perform FindVariableFeatures on the data 5/5 of the srtList...
#> Use the separate HVF from srtList...
#> Number of available HVF: 2000
#> [2023-11-21 07:28:34.297925] Finished checking.
#> [2023-11-21 07:28:35.085951] Perform FindIntegrationAnchors on the data...
#> [2023-11-21 07:28:53.076135] Perform integration(Seurat) on the data...
#> [2023-11-21 07:28:58.92266] Perform ScaleData on the data...
#> [2023-11-21 07:28:59.071587] Perform linear dimension reduction (pca) on the data...
#> Warning: The following arguments are not used: force.recalc
#> Warning: The following arguments are not used: force.recalc
#> [2023-11-21 07:28:59.913342] Perform FindClusters (louvain) on the data...
#> [2023-11-21 07:29:00.044658] Reorder clusters...
#> [2023-11-21 07:29:00.123422] Perform nonlinear dimension reduction (umap) on the data...
#> Non-linear dimensionality reduction(umap) using Reduction(Seuratpca, dims:1-12) as input
#> Found more than one class "dist" in cache; using the first, from namespace 'BiocGenerics'
#> Also defined by ‘spam’
#> Found more than one class "dist" in cache; using the first, from namespace 'BiocGenerics'
#> Also defined by ‘spam’
#> Non-linear dimensionality reduction(umap) using Reduction(Seuratpca, dims:1-12) as input
#> Found more than one class "dist" in cache; using the first, from namespace 'BiocGenerics'
#> Also defined by ‘spam’
#> Found more than one class "dist" in cache; using the first, from namespace 'BiocGenerics'
#> Also defined by ‘spam’
#> [2023-11-21 07:29:09.036984] Seurat_integrate done
#> Elapsed time: 36.92 secs
CellDimPlot(panc8_sub, group.by = c("celltype", "tech"))
 panc8_sub <- RunDEtest(panc8_sub, group_by = "celltype", grouping.var = "tech", markers_type = "conserved")
#> [2023-11-21 07:29:09.654979] Start DEtest
#> Workers: 2
#> Find conserved markers(wilcox) among 13 groups...
#>
|
| | 0%
#>
#>
#>
#>
#>
#>
#>
#>
#>
#>
#>
#>
#>
#>
#>
#>
#>
#>
#>
#>
#>
#>
#>
#>
#>
#>
#>
|
|=================================================== | 46%
#>
#>
#>
#>
#>
#>
#>
#>
#>
|
|==============================================================================================================| 100%
#>
#> [2023-11-21 07:31:27.312687] DEtest done
#> Elapsed time:2.29 mins
ConservedMarkers1 <- filter(panc8_sub@tools$DEtest_celltype$ConservedMarkers_wilcox, p_val_adj < 0.05 & avg_log2FC > 1)
table(ConservedMarkers1$group1)
#>
#> alpha beta ductal acinar activated_stellate gamma
#> 125 258 619 242 502 60
#> delta epsilon mast endothelial macrophage quiescent_stellate
#> 45 0 0 235 243 136
#> schwann
#> 79
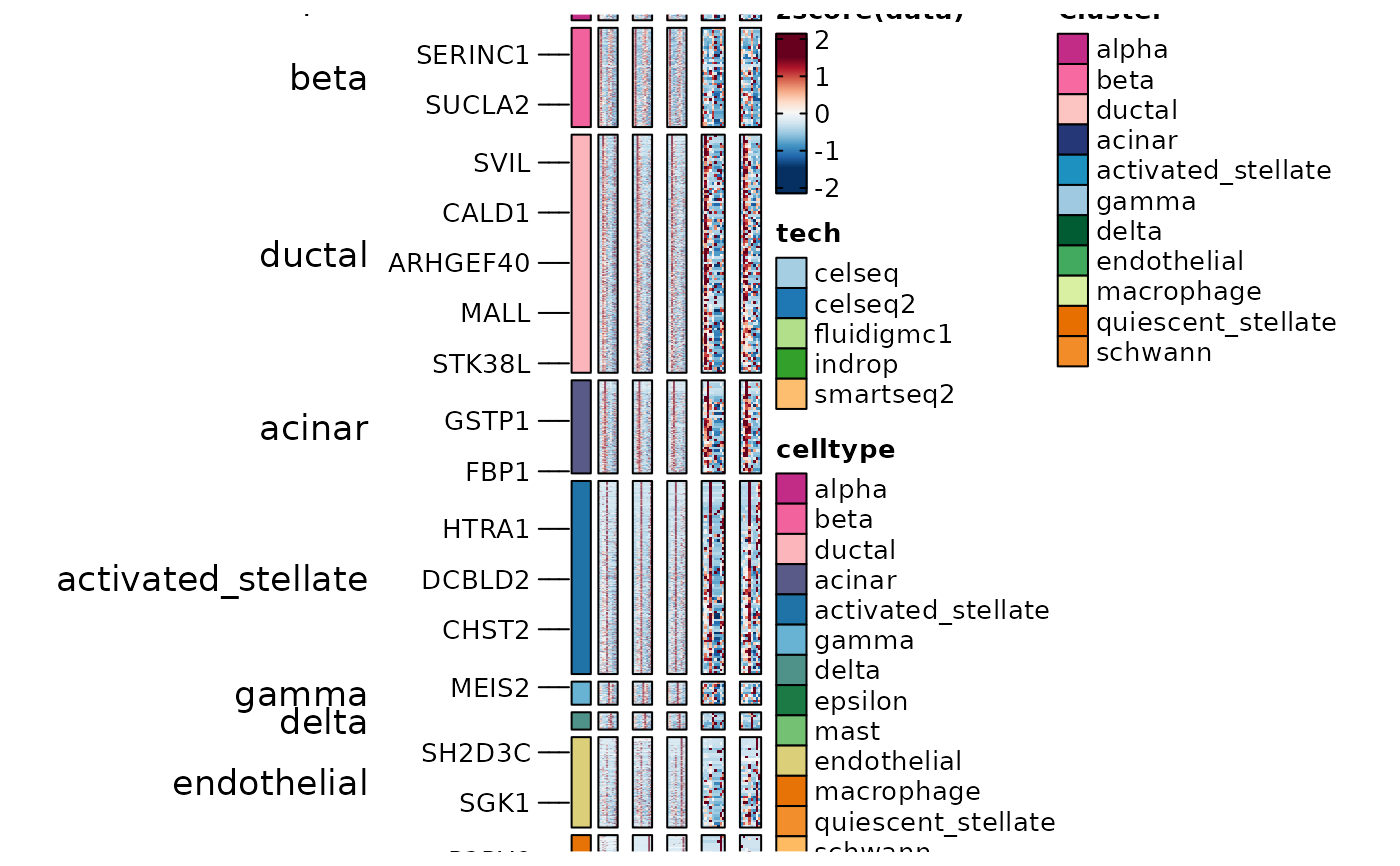
ht4 <- GroupHeatmap(panc8_sub,
slot = "data",
features = ConservedMarkers1$gene, feature_split = ConservedMarkers1$group1,
group.by = "tech", split.by = "celltype", within_groups = TRUE
)
#> 'magick' package is suggested to install to give better rasterization.
#>
#> Set `ht_opt$message = FALSE` to turn off this message.
#> `use_raster` is automatically set to TRUE for a matrix with more than 2000 rows. You can control
#> `use_raster` argument by explicitly setting TRUE/FALSE to it.
#>
#> Set `ht_opt$message = FALSE` to turn off this message.
#> `use_raster` is automatically set to TRUE for a matrix with more than 2000 rows. You can control
#> `use_raster` argument by explicitly setting TRUE/FALSE to it.
#>
#> Set `ht_opt$message = FALSE` to turn off this message.
#>
#> The size of the heatmap is fixed because certain elements are not scalable.
#> The width and height of the heatmap are determined by the size of the current viewport.
#> If you want to have more control over the size, you can manually set the parameters 'width' and 'height'.
ht4$plot
panc8_sub <- RunDEtest(panc8_sub, group_by = "celltype", grouping.var = "tech", markers_type = "conserved")
#> [2023-11-21 07:29:09.654979] Start DEtest
#> Workers: 2
#> Find conserved markers(wilcox) among 13 groups...
#>
|
| | 0%
#>
#>
#>
#>
#>
#>
#>
#>
#>
#>
#>
#>
#>
#>
#>
#>
#>
#>
#>
#>
#>
#>
#>
#>
#>
#>
#>
|
|=================================================== | 46%
#>
#>
#>
#>
#>
#>
#>
#>
#>
|
|==============================================================================================================| 100%
#>
#> [2023-11-21 07:31:27.312687] DEtest done
#> Elapsed time:2.29 mins
ConservedMarkers1 <- filter(panc8_sub@tools$DEtest_celltype$ConservedMarkers_wilcox, p_val_adj < 0.05 & avg_log2FC > 1)
table(ConservedMarkers1$group1)
#>
#> alpha beta ductal acinar activated_stellate gamma
#> 125 258 619 242 502 60
#> delta epsilon mast endothelial macrophage quiescent_stellate
#> 45 0 0 235 243 136
#> schwann
#> 79
ht4 <- GroupHeatmap(panc8_sub,
slot = "data",
features = ConservedMarkers1$gene, feature_split = ConservedMarkers1$group1,
group.by = "tech", split.by = "celltype", within_groups = TRUE
)
#> 'magick' package is suggested to install to give better rasterization.
#>
#> Set `ht_opt$message = FALSE` to turn off this message.
#> `use_raster` is automatically set to TRUE for a matrix with more than 2000 rows. You can control
#> `use_raster` argument by explicitly setting TRUE/FALSE to it.
#>
#> Set `ht_opt$message = FALSE` to turn off this message.
#> `use_raster` is automatically set to TRUE for a matrix with more than 2000 rows. You can control
#> `use_raster` argument by explicitly setting TRUE/FALSE to it.
#>
#> Set `ht_opt$message = FALSE` to turn off this message.
#>
#> The size of the heatmap is fixed because certain elements are not scalable.
#> The width and height of the heatmap are determined by the size of the current viewport.
#> If you want to have more control over the size, you can manually set the parameters 'width' and 'height'.
ht4$plot
 panc8_sub <- RunDEtest(panc8_sub, group_by = "tech", grouping.var = "celltype", markers_type = "conserved")
#> [2023-11-21 07:31:46.176069] Start DEtest
#> Workers: 2
#> Find conserved markers(wilcox) among 5 groups...
#>
|
| | 0%
#>
#>
#>
#>
#>
#>
#>
#>
#>
#>
#>
#>
|
|============================================ | 40%
#>
#>
#>
#>
#>
#>
#>
#>
#>
#>
#>
#>
#>
#>
#>
#>
#>
#>
#>
#>
#>
|
|==============================================================================================================| 100%
#>
#> [2023-11-21 07:33:17.584565] DEtest done
#> Elapsed time:1.52 mins
ConservedMarkers2 <- filter(panc8_sub@tools$DEtest_tech$ConservedMarkers_wilcox, p_val_adj < 0.05 & avg_log2FC > 1)
table(ConservedMarkers2$group1)
#>
#> celseq celseq2 fluidigmc1 indrop smartseq2
#> 92 198 905 56 353
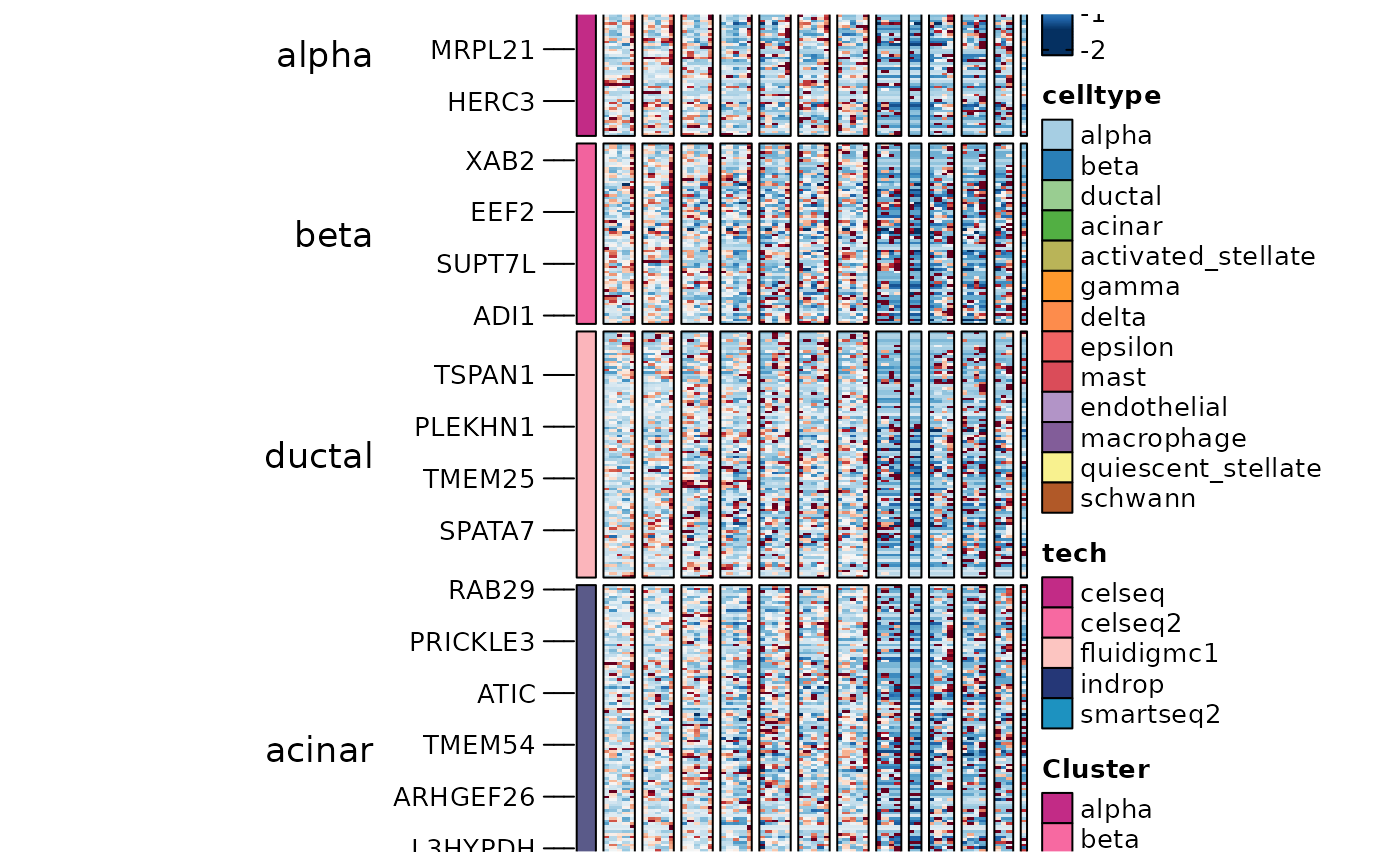
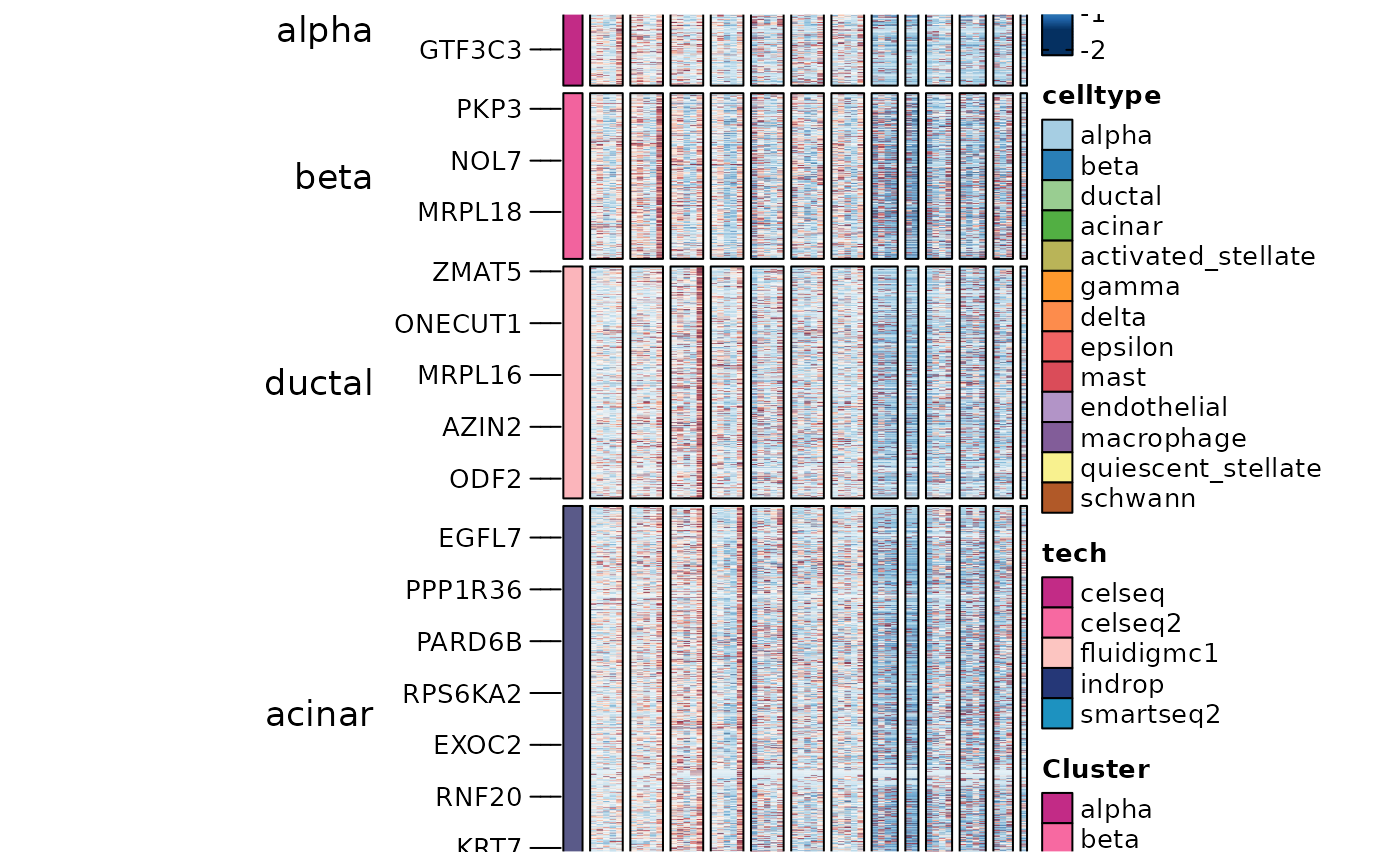
ht4 <- GroupHeatmap(panc8_sub,
slot = "data",
features = ConservedMarkers2$gene, feature_split = ConservedMarkers2$group1,
group.by = "tech", split.by = "celltype"
)
#> 'magick' package is suggested to install to give better rasterization.
#>
#> Set `ht_opt$message = FALSE` to turn off this message.
#>
#> The size of the heatmap is fixed because certain elements are not scalable.
#> The width and height of the heatmap are determined by the size of the current viewport.
#> If you want to have more control over the size, you can manually set the parameters 'width' and 'height'.
ht4$plot
panc8_sub <- RunDEtest(panc8_sub, group_by = "tech", grouping.var = "celltype", markers_type = "conserved")
#> [2023-11-21 07:31:46.176069] Start DEtest
#> Workers: 2
#> Find conserved markers(wilcox) among 5 groups...
#>
|
| | 0%
#>
#>
#>
#>
#>
#>
#>
#>
#>
#>
#>
#>
|
|============================================ | 40%
#>
#>
#>
#>
#>
#>
#>
#>
#>
#>
#>
#>
#>
#>
#>
#>
#>
#>
#>
#>
#>
|
|==============================================================================================================| 100%
#>
#> [2023-11-21 07:33:17.584565] DEtest done
#> Elapsed time:1.52 mins
ConservedMarkers2 <- filter(panc8_sub@tools$DEtest_tech$ConservedMarkers_wilcox, p_val_adj < 0.05 & avg_log2FC > 1)
table(ConservedMarkers2$group1)
#>
#> celseq celseq2 fluidigmc1 indrop smartseq2
#> 92 198 905 56 353
ht4 <- GroupHeatmap(panc8_sub,
slot = "data",
features = ConservedMarkers2$gene, feature_split = ConservedMarkers2$group1,
group.by = "tech", split.by = "celltype"
)
#> 'magick' package is suggested to install to give better rasterization.
#>
#> Set `ht_opt$message = FALSE` to turn off this message.
#>
#> The size of the heatmap is fixed because certain elements are not scalable.
#> The width and height of the heatmap are determined by the size of the current viewport.
#> If you want to have more control over the size, you can manually set the parameters 'width' and 'height'.
ht4$plot
 panc8_sub <- RunDEtest(panc8_sub, group_by = "celltype", grouping.var = "tech", markers_type = "disturbed")
#> [2023-11-21 07:33:24.718855] Start DEtest
#> Workers: 2
#> Find disturbed markers(wilcox) among 13 groups...
#>
|
| | 0%
#>
|
| | 0%
|
|==============================================================================================================| 100%
#>
#>
|
| | 0%
|
|==============================================================================================================| 100%
#>
#>
|
| | 0%
#>
|
|==============================================================================================================| 100%
#>
#>
|
| | 0%
#>
|
|==============================================================================================================| 100%
#>
#>
|
| | 0%
#>
|
|==============================================================================================================| 100%
#>
#>
|
|=================================================== | 46%
#>
|
| | 0%
#>
|
|==============================================================================================================| 100%
#>
#>
|
| | 0%
#>
|
|==============================================================================================================| 100%
#>
#>
|
| | 0%
#>
|
|==============================================================================================================| 100%
#>
#>
|
| | 0%
#>
|
|==============================================================================================================| 100%
#>
#>
|
| | 0%
#>
|
|==============================================================================================================| 100%
#>
#>
|
| | 0%
#>
|
|==============================================================================================================| 100%
#>
#>
|
| | 0%
#>
|
|==============================================================================================================| 100%
#>
#>
|
|==============================================================================================================| 100%
#>
#> [2023-11-21 07:35:35.54098] DEtest done
#> Elapsed time:2.18 mins
DisturbedMarkers <- filter(panc8_sub@tools$DEtest_celltype$DisturbedMarkers_wilcox, p_val_adj < 0.05 & avg_log2FC > 1 & var1 == "smartseq2")
table(DisturbedMarkers$group1)
#>
#> alpha beta ductal acinar activated_stellate gamma
#> 950 1047 1428 1903 45 76
#> delta epsilon mast endothelial macrophage quiescent_stellate
#> 405 0 0 0 0 0
#> schwann
#> 0
ht5 <- GroupHeatmap(panc8_sub,
slot = "data",
features = DisturbedMarkers$gene, feature_split = DisturbedMarkers$group1,
group.by = "celltype", split.by = "tech"
)
#> 'magick' package is suggested to install to give better rasterization.
#>
#> Set `ht_opt$message = FALSE` to turn off this message.
#> `use_raster` is automatically set to TRUE for a matrix with more than 2000 rows. You can control
#> `use_raster` argument by explicitly setting TRUE/FALSE to it.
#>
#> Set `ht_opt$message = FALSE` to turn off this message.
#>
#> The size of the heatmap is fixed because certain elements are not scalable.
#> The width and height of the heatmap are determined by the size of the current viewport.
#> If you want to have more control over the size, you can manually set the parameters 'width' and 'height'.
ht5$plot
panc8_sub <- RunDEtest(panc8_sub, group_by = "celltype", grouping.var = "tech", markers_type = "disturbed")
#> [2023-11-21 07:33:24.718855] Start DEtest
#> Workers: 2
#> Find disturbed markers(wilcox) among 13 groups...
#>
|
| | 0%
#>
|
| | 0%
|
|==============================================================================================================| 100%
#>
#>
|
| | 0%
|
|==============================================================================================================| 100%
#>
#>
|
| | 0%
#>
|
|==============================================================================================================| 100%
#>
#>
|
| | 0%
#>
|
|==============================================================================================================| 100%
#>
#>
|
| | 0%
#>
|
|==============================================================================================================| 100%
#>
#>
|
|=================================================== | 46%
#>
|
| | 0%
#>
|
|==============================================================================================================| 100%
#>
#>
|
| | 0%
#>
|
|==============================================================================================================| 100%
#>
#>
|
| | 0%
#>
|
|==============================================================================================================| 100%
#>
#>
|
| | 0%
#>
|
|==============================================================================================================| 100%
#>
#>
|
| | 0%
#>
|
|==============================================================================================================| 100%
#>
#>
|
| | 0%
#>
|
|==============================================================================================================| 100%
#>
#>
|
| | 0%
#>
|
|==============================================================================================================| 100%
#>
#>
|
|==============================================================================================================| 100%
#>
#> [2023-11-21 07:35:35.54098] DEtest done
#> Elapsed time:2.18 mins
DisturbedMarkers <- filter(panc8_sub@tools$DEtest_celltype$DisturbedMarkers_wilcox, p_val_adj < 0.05 & avg_log2FC > 1 & var1 == "smartseq2")
table(DisturbedMarkers$group1)
#>
#> alpha beta ductal acinar activated_stellate gamma
#> 950 1047 1428 1903 45 76
#> delta epsilon mast endothelial macrophage quiescent_stellate
#> 405 0 0 0 0 0
#> schwann
#> 0
ht5 <- GroupHeatmap(panc8_sub,
slot = "data",
features = DisturbedMarkers$gene, feature_split = DisturbedMarkers$group1,
group.by = "celltype", split.by = "tech"
)
#> 'magick' package is suggested to install to give better rasterization.
#>
#> Set `ht_opt$message = FALSE` to turn off this message.
#> `use_raster` is automatically set to TRUE for a matrix with more than 2000 rows. You can control
#> `use_raster` argument by explicitly setting TRUE/FALSE to it.
#>
#> Set `ht_opt$message = FALSE` to turn off this message.
#>
#> The size of the heatmap is fixed because certain elements are not scalable.
#> The width and height of the heatmap are determined by the size of the current viewport.
#> If you want to have more control over the size, you can manually set the parameters 'width' and 'height'.
ht5$plot
 gene_specific <- names(which(table(DisturbedMarkers$gene) == 1))
DisturbedMarkers_specific <- DisturbedMarkers[DisturbedMarkers$gene %in% gene_specific, ]
table(DisturbedMarkers_specific$group1)
#>
#> alpha beta ductal acinar activated_stellate gamma
#> 221 323 452 805 5 15
#> delta epsilon mast endothelial macrophage quiescent_stellate
#> 145 0 0 0 0 0
#> schwann
#> 0
ht6 <- GroupHeatmap(panc8_sub,
slot = "data",
features = DisturbedMarkers_specific$gene, feature_split = DisturbedMarkers_specific$group1,
group.by = "celltype", split.by = "tech"
)
#> 'magick' package is suggested to install to give better rasterization.
#>
#> Set `ht_opt$message = FALSE` to turn off this message.
#>
#> The size of the heatmap is fixed because certain elements are not scalable.
#> The width and height of the heatmap are determined by the size of the current viewport.
#> If you want to have more control over the size, you can manually set the parameters 'width' and 'height'.
ht6$plot
gene_specific <- names(which(table(DisturbedMarkers$gene) == 1))
DisturbedMarkers_specific <- DisturbedMarkers[DisturbedMarkers$gene %in% gene_specific, ]
table(DisturbedMarkers_specific$group1)
#>
#> alpha beta ductal acinar activated_stellate gamma
#> 221 323 452 805 5 15
#> delta epsilon mast endothelial macrophage quiescent_stellate
#> 145 0 0 0 0 0
#> schwann
#> 0
ht6 <- GroupHeatmap(panc8_sub,
slot = "data",
features = DisturbedMarkers_specific$gene, feature_split = DisturbedMarkers_specific$group1,
group.by = "celltype", split.by = "tech"
)
#> 'magick' package is suggested to install to give better rasterization.
#>
#> Set `ht_opt$message = FALSE` to turn off this message.
#>
#> The size of the heatmap is fixed because certain elements are not scalable.
#> The width and height of the heatmap are determined by the size of the current viewport.
#> If you want to have more control over the size, you can manually set the parameters 'width' and 'height'.
ht6$plot
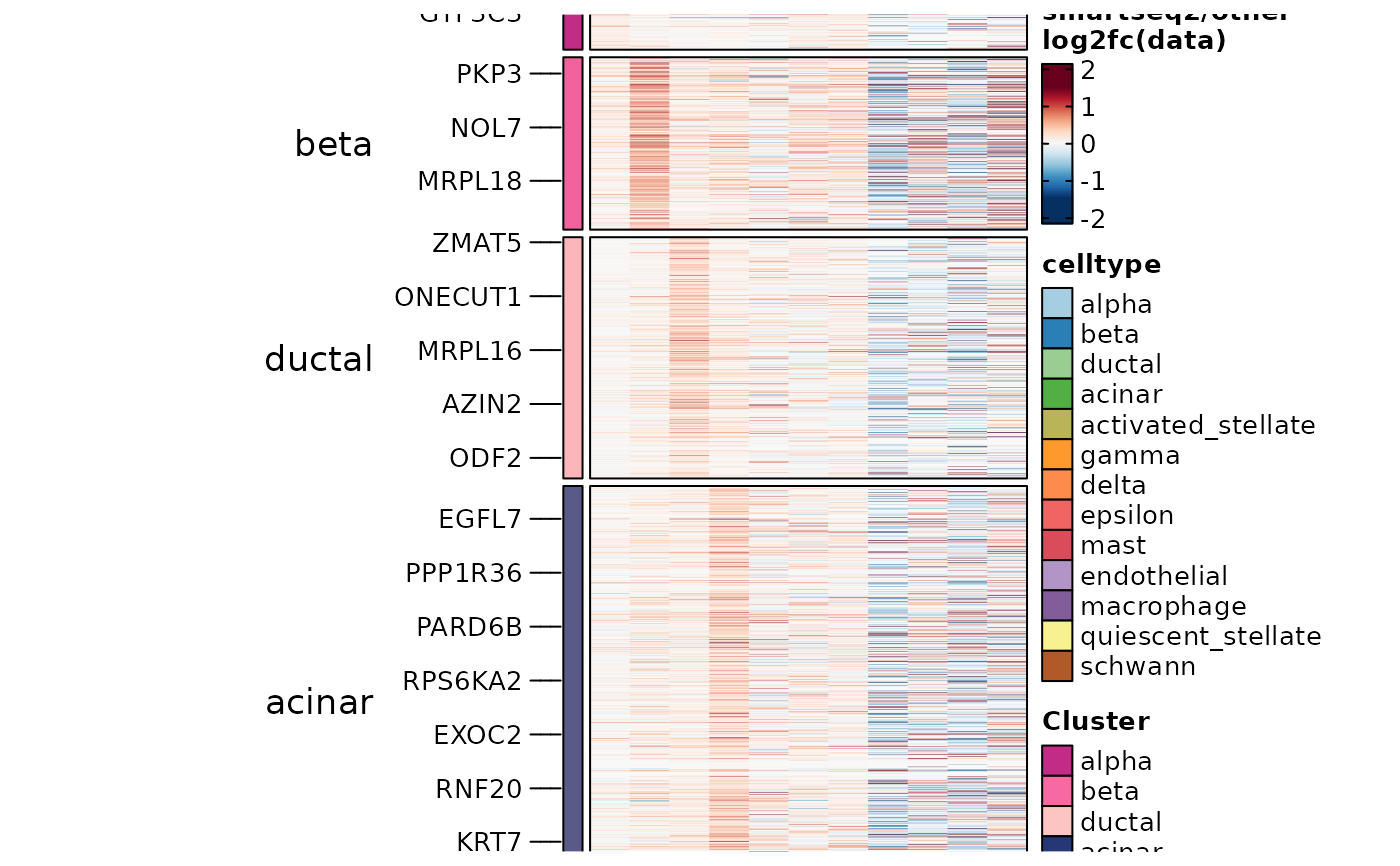
 ht7 <- GroupHeatmap(panc8_sub,
slot = "data", aggregate_fun = function(x) mean(expm1(x)) + 1,
features = DisturbedMarkers_specific$gene, feature_split = DisturbedMarkers_specific$group1,
group.by = "celltype", grouping.var = "tech", numerator = "smartseq2"
)
#> Warning: When 'grouping.var' is specified, 'exp_method' can only be 'log2fc'
#> 'magick' package is suggested to install to give better rasterization.
#>
#> Set `ht_opt$message = FALSE` to turn off this message.
#>
#> The size of the heatmap is fixed because certain elements are not scalable.
#> The width and height of the heatmap are determined by the size of the current viewport.
#> If you want to have more control over the size, you can manually set the parameters 'width' and 'height'.
ht7$plot
ht7 <- GroupHeatmap(panc8_sub,
slot = "data", aggregate_fun = function(x) mean(expm1(x)) + 1,
features = DisturbedMarkers_specific$gene, feature_split = DisturbedMarkers_specific$group1,
group.by = "celltype", grouping.var = "tech", numerator = "smartseq2"
)
#> Warning: When 'grouping.var' is specified, 'exp_method' can only be 'log2fc'
#> 'magick' package is suggested to install to give better rasterization.
#>
#> Set `ht_opt$message = FALSE` to turn off this message.
#>
#> The size of the heatmap is fixed because certain elements are not scalable.
#> The width and height of the heatmap are determined by the size of the current viewport.
#> If you want to have more control over the size, you can manually set the parameters 'width' and 'height'.
ht7$plot