Plotting cell points on a reduced 2D plane and coloring according to the groups of the cells.
Usage
ClassDimPlot(
  srt,
  group.by = "orig.ident",
  reduction = NULL,
  dims = c(1, 2),
  split.by = NULL,
  cells = NULL,
  show_na = FALSE,
  show_stat = TRUE,
  pt.size = NULL,
  pt.alpha = 1,
  palette = "Paired",
  palcolor = NULL,
  bg_color = "grey80",
  label = FALSE,
  label.size = 4,
  label.fg = "white",
  label.bg = "black",
  label.bg.r = 0.1,
  label_insitu = FALSE,
  label_repel = FALSE,
  label_repulsion = 20,
  label_point_size = 1,
  label_point_color = "black",
  label_segment_color = "black",
  cells.highlight = NULL,
  cols.highlight = "black",
  sizes.highlight = 1,
  alpha.highlight = 1,
  stroke.highlight = 0.5,
  add_density = FALSE,
  density_color = "grey80",
  density_filled = FALSE,
  density_filled_palette = "Greys",
  density_filled_color = NULL,
  lineages = NULL,
  lineages_trim = c(0.01, 0.99),
  lineages_span = 0.75,
  lineages_palette = "Dark2",
  lineages_palcolor = NULL,
  lineages_arrow = arrow(length = unit(0.1, "inches")),
  lineages_line_size = 1,
  lineages_line_bg = "white",
  lineages_line_bg_r = 0.5,
  lineages_whiskers = FALSE,
  lineages_whiskers_size = 0.5,
  lineages_whiskers_alpha = 0.5,
  stat.by = NULL,
  stat_type = "percent",
  stat_plot_type = "pie",
  stat_plot_position = c("stack", "dodge"),
  stat_plot_size = 0.1,
  stat_plot_palette = "Set1",
  stat_palcolor = NULL,
  stat_plot_alpha = 1,
  stat_plot_label = FALSE,
  stat_plot_label_size = 3,
  graph = NULL,
  edge_size = c(0.05, 0.5),
  edge_alpha = 0.1,
  edge_color = "grey40",
  paga = NULL,
  paga_type = "connectivities",
  paga_node_size = 4,
  paga_edge_threshold = 0.01,
  paga_edge_size = c(0.2, 1),
  paga_edge_color = "grey40",
  paga_edge_alpha = 0.5,
  paga_transition_threshold = 0.01,
  paga_transition_size = c(0.2, 1),
  paga_transition_color = "black",
  paga_transition_alpha = 1,
  paga_show_transition = FALSE,
  velocity = NULL,
  velocity_plot_type = "raw",
  velocity_n_neighbors = ceiling(ncol(srt)/50),
  velocity_density = 1,
  velocity_smooth = 0.5,
  velocity_scale = 1,
  velocity_min_mass = 1,
  velocity_cutoff_perc = 5,
  velocity_arrow_color = "black",
  velocity_arrow_angle = 20,
  velocity_arrow_flank = 0.8,
  streamline_L = 5,
  streamline_minL = 1,
  streamline_res = 1,
  streamline_n = 15,
  streamline_jitter = 1,
  streamline_size = c(0, 0.8),
  streamline_alpha = 1,
  streamline_color = NULL,
  streamline_palette = "RdYlBu",
  streamline_palcolor = NULL,
  streamline_bg_color = "white",
  streamline_bg_stroke = 0.5,
  hex = FALSE,
  hex.linewidth = 0.5,
  hex.count = TRUE,
  hex.bins = 50,
  hex.binwidth = NULL,
  raster = NULL,
  raster.dpi = c(512, 512),
  theme_use = "theme_scp",
  aspect.ratio = 1,
  title = NULL,
  subtitle = NULL,
  xlab = NULL,
  ylab = NULL,
  lab_cex = 1,
  xlen_npc = 0.15,
  ylen_npc = 0.15,
  legend.position = "right",
  legend.direction = "vertical",
  combine = TRUE,
  nrow = NULL,
  ncol = NULL,
  byrow = TRUE,
  align = "hv",
  axis = "lr",
  force = FALSE
)
Arguments
- srt
A Seurat object.
- group.by
Name of one or more metadata columns to group (color) cells by (for example, orig.ident).
- reduction
Which dimensionality reduction to use.
- split.by
Name of a metadata column to split plot by.
- cells
- pt.size
Point size for plotting.
- pt.alpha
Point transparency.
- palette
Name of palette to use. Default is "Paired".
- bg_color
Color value for NA points.
- label
Whether to label the groups.
- label.size
Plot resolution. Only valid when
unitsis notpx- label_insitu
Whether place the raw label text in the original position. Default is FALSE, which using numbers instead of raw labels.
- cells.highlight
A vector of names of cells to highlight.
- cols.highlight
A vector of colors to highlight the cells.
- sizes.highlight
Size of highlighted cells.
- legend.position
The position of legends ("none", "left", "right", "bottom", "top", or two-element numeric vector)
- legend.direction
Layout of items in legends ("horizontal" or "vertical")
- combine
Whether to arrange multiple plots into a grid.
- nrow
Number of rows in the plot grid.
- ncol
Number of columns in the plot grid.
- byrow
Logical value indicating if the plots should be arrange by row (default) or by column.
Examples
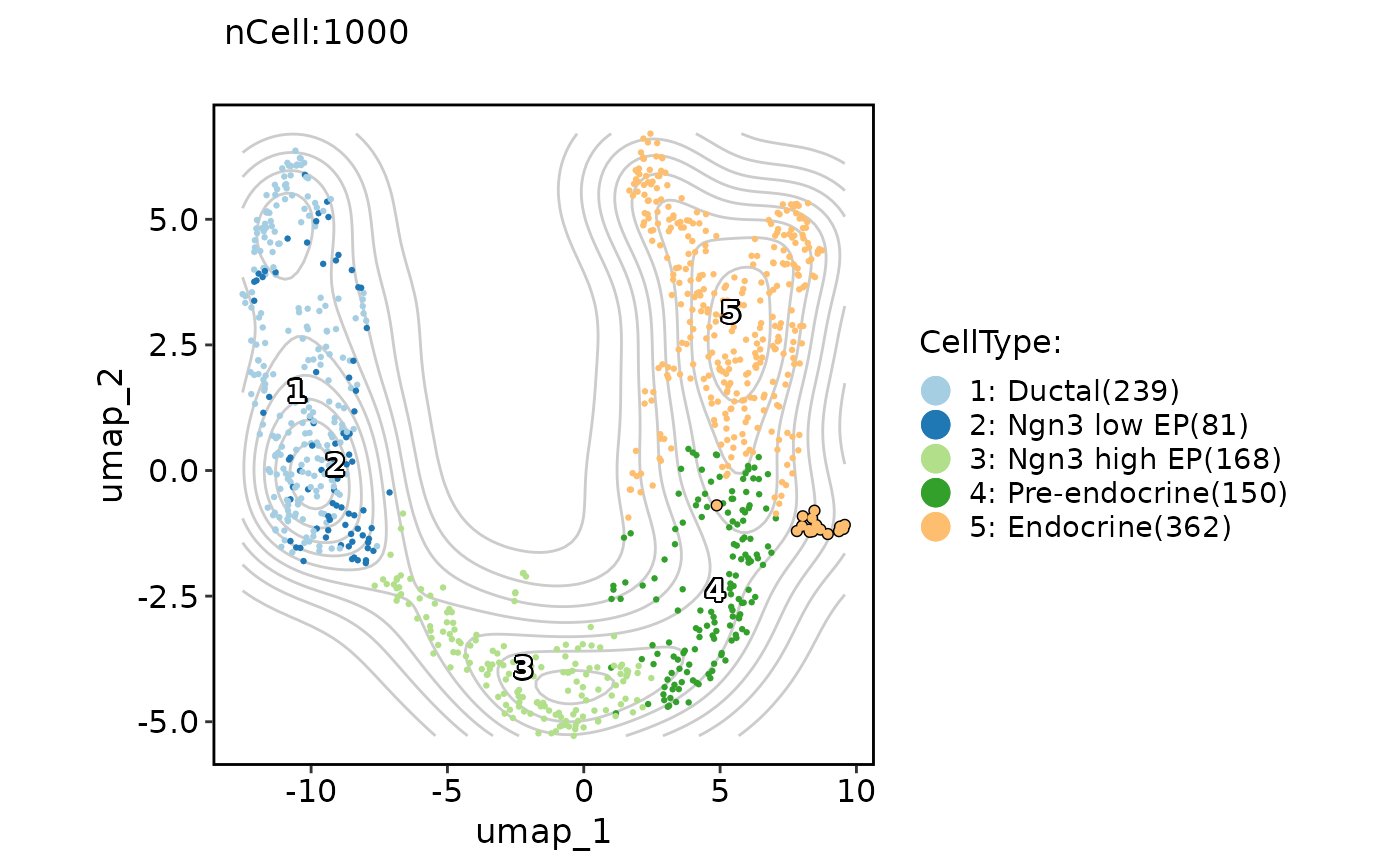
data("pancreas_sub")
ClassDimPlot(pancreas_sub,
group.by = "CellType", reduction = "UMAP", label = TRUE, add_density = TRUE,
cells.highlight = colnames(pancreas_sub)[pancreas_sub$SubCellType == "Delta"]
)
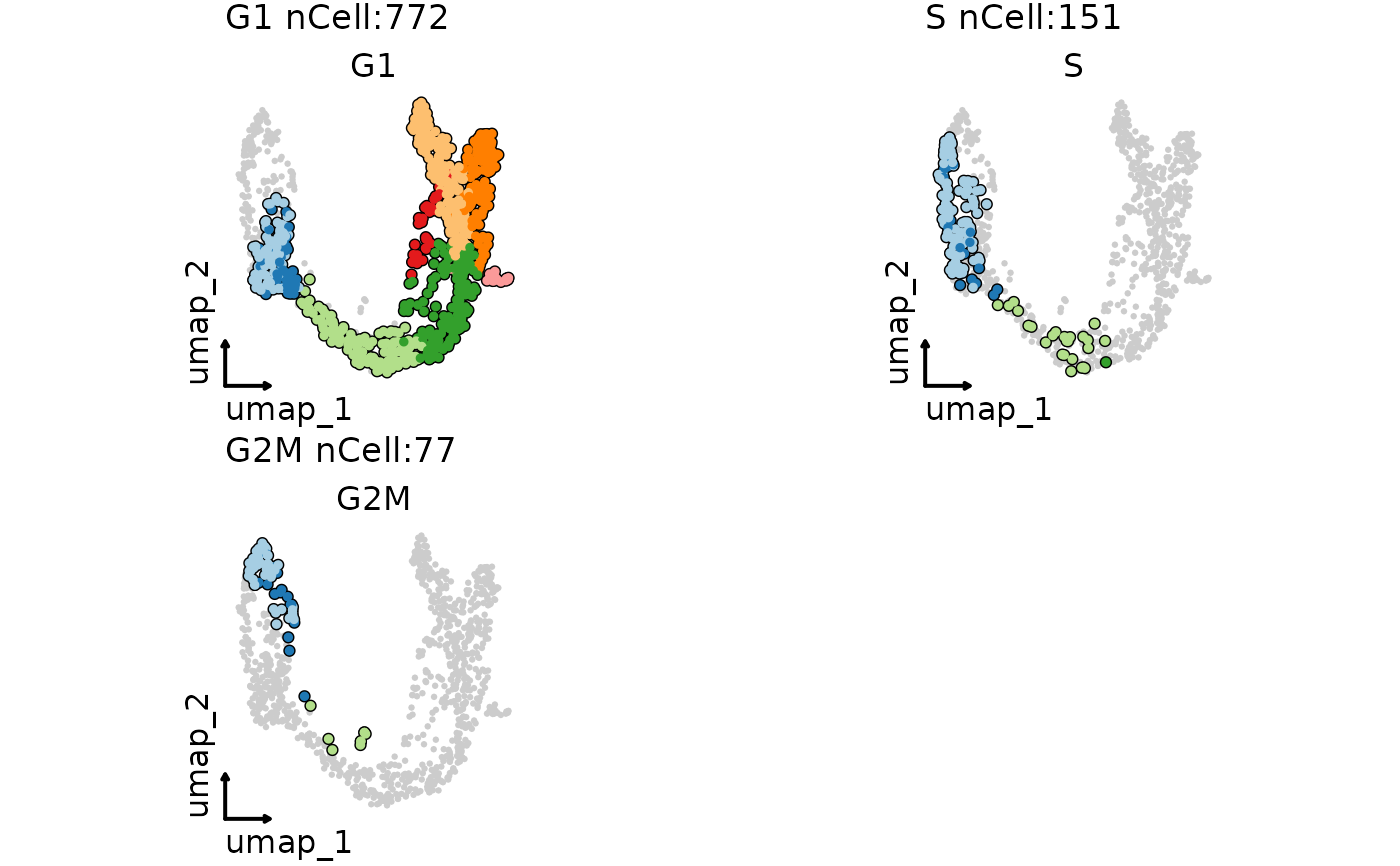
 ClassDimPlot(pancreas_sub,
group.by = "SubCellType", split.by = "Phase", cells.highlight = TRUE,
theme_use = "theme_blank", legend.position = "none"
)
ClassDimPlot(pancreas_sub,
group.by = "SubCellType", split.by = "Phase", cells.highlight = TRUE,
theme_use = "theme_blank", legend.position = "none"
)
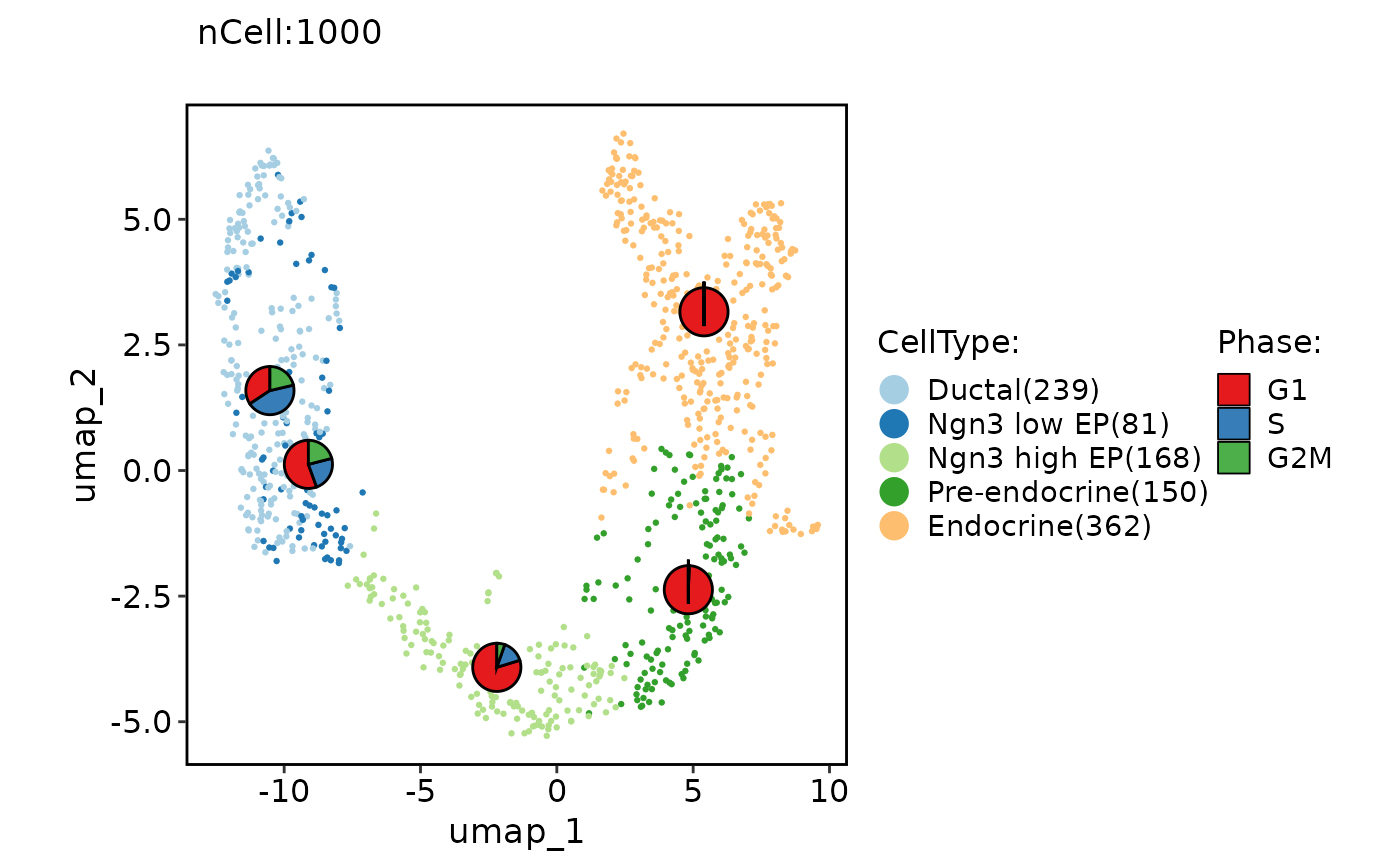
 # Add statistical chart
ClassDimPlot(pancreas_sub, group.by = "CellType", reduction = "UMAP", stat.by = "Phase")
# Add statistical chart
ClassDimPlot(pancreas_sub, group.by = "CellType", reduction = "UMAP", stat.by = "Phase")
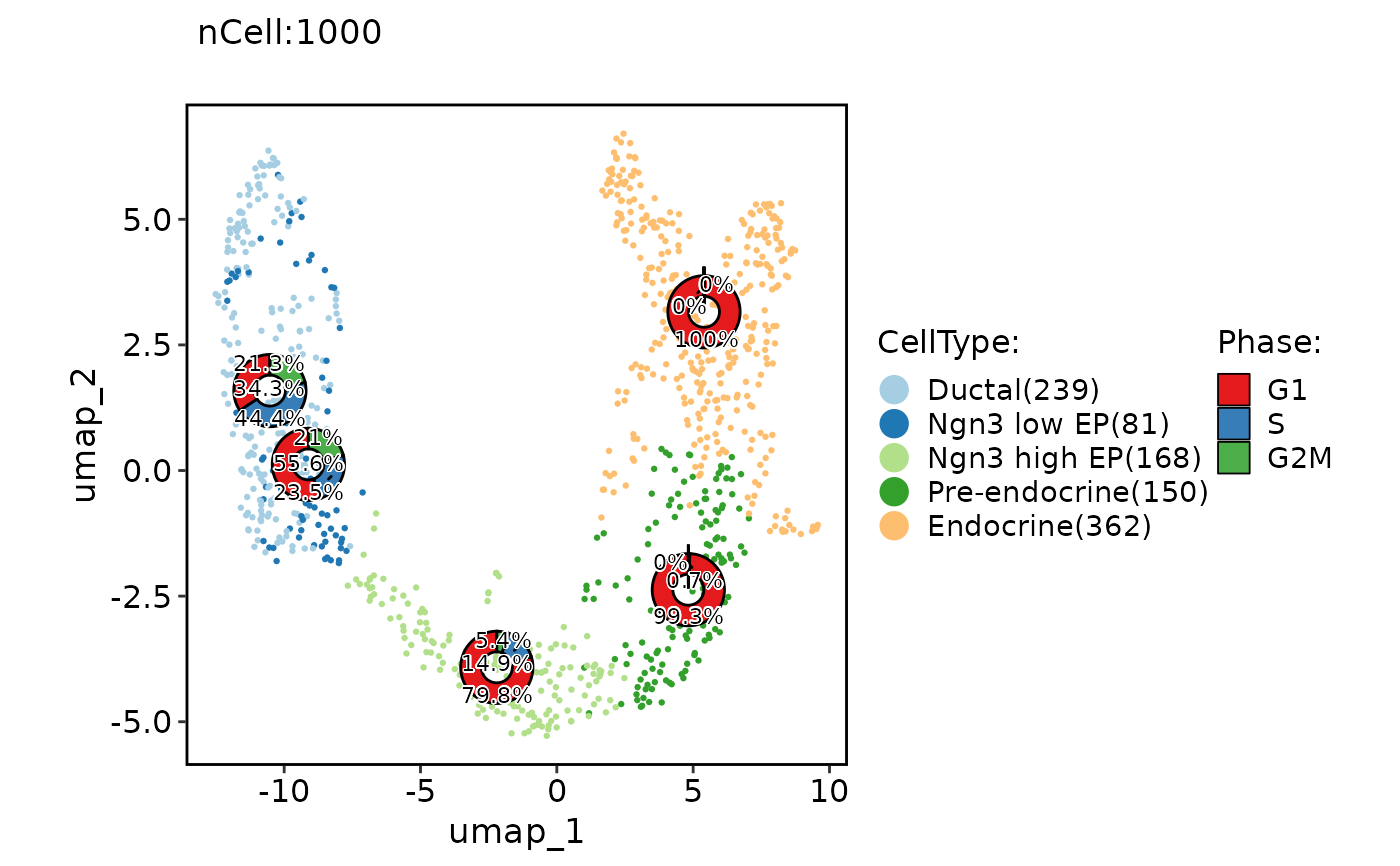
 ClassDimPlot(pancreas_sub, group.by = "CellType", reduction = "UMAP", stat.by = "Phase", stat_plot_type = "ring", stat_plot_label = TRUE, stat_plot_size = 0.15)
#> Warning: Removed 1 rows containing missing values (`position_stack()`).
#> Warning: Removed 1 rows containing missing values (`position_stack()`).
#> Warning: Removed 1 rows containing missing values (`position_stack()`).
#> Warning: Removed 1 rows containing missing values (`position_stack()`).
#> Warning: Removed 1 rows containing missing values (`position_stack()`).
#> Warning: Removed 1 rows containing missing values (`position_stack()`).
#> Warning: Removed 1 rows containing missing values (`position_stack()`).
#> Warning: Removed 1 rows containing missing values (`position_stack()`).
#> Warning: Removed 1 rows containing missing values (`position_stack()`).
#> Warning: Removed 1 rows containing missing values (`position_stack()`).
#> Warning: Removed 1 rows containing missing values (`position_stack()`).
#> Warning: Removed 1 rows containing missing values (`position_stack()`).
ClassDimPlot(pancreas_sub, group.by = "CellType", reduction = "UMAP", stat.by = "Phase", stat_plot_type = "ring", stat_plot_label = TRUE, stat_plot_size = 0.15)
#> Warning: Removed 1 rows containing missing values (`position_stack()`).
#> Warning: Removed 1 rows containing missing values (`position_stack()`).
#> Warning: Removed 1 rows containing missing values (`position_stack()`).
#> Warning: Removed 1 rows containing missing values (`position_stack()`).
#> Warning: Removed 1 rows containing missing values (`position_stack()`).
#> Warning: Removed 1 rows containing missing values (`position_stack()`).
#> Warning: Removed 1 rows containing missing values (`position_stack()`).
#> Warning: Removed 1 rows containing missing values (`position_stack()`).
#> Warning: Removed 1 rows containing missing values (`position_stack()`).
#> Warning: Removed 1 rows containing missing values (`position_stack()`).
#> Warning: Removed 1 rows containing missing values (`position_stack()`).
#> Warning: Removed 1 rows containing missing values (`position_stack()`).
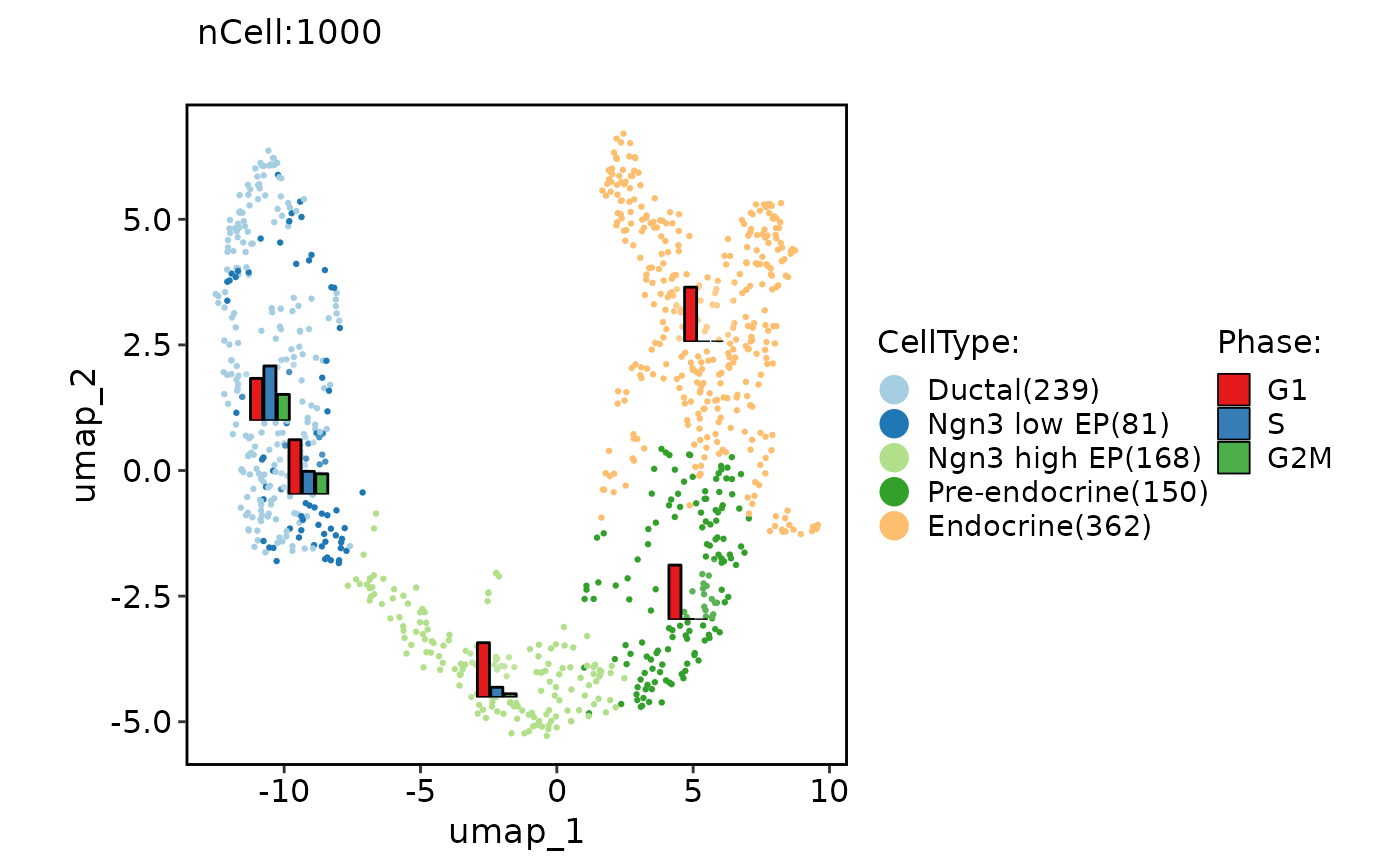
 ClassDimPlot(pancreas_sub, group.by = "CellType", reduction = "UMAP", stat.by = "Phase", stat_type = "count", stat_plot_type = "bar", stat_plot_position = "dodge")
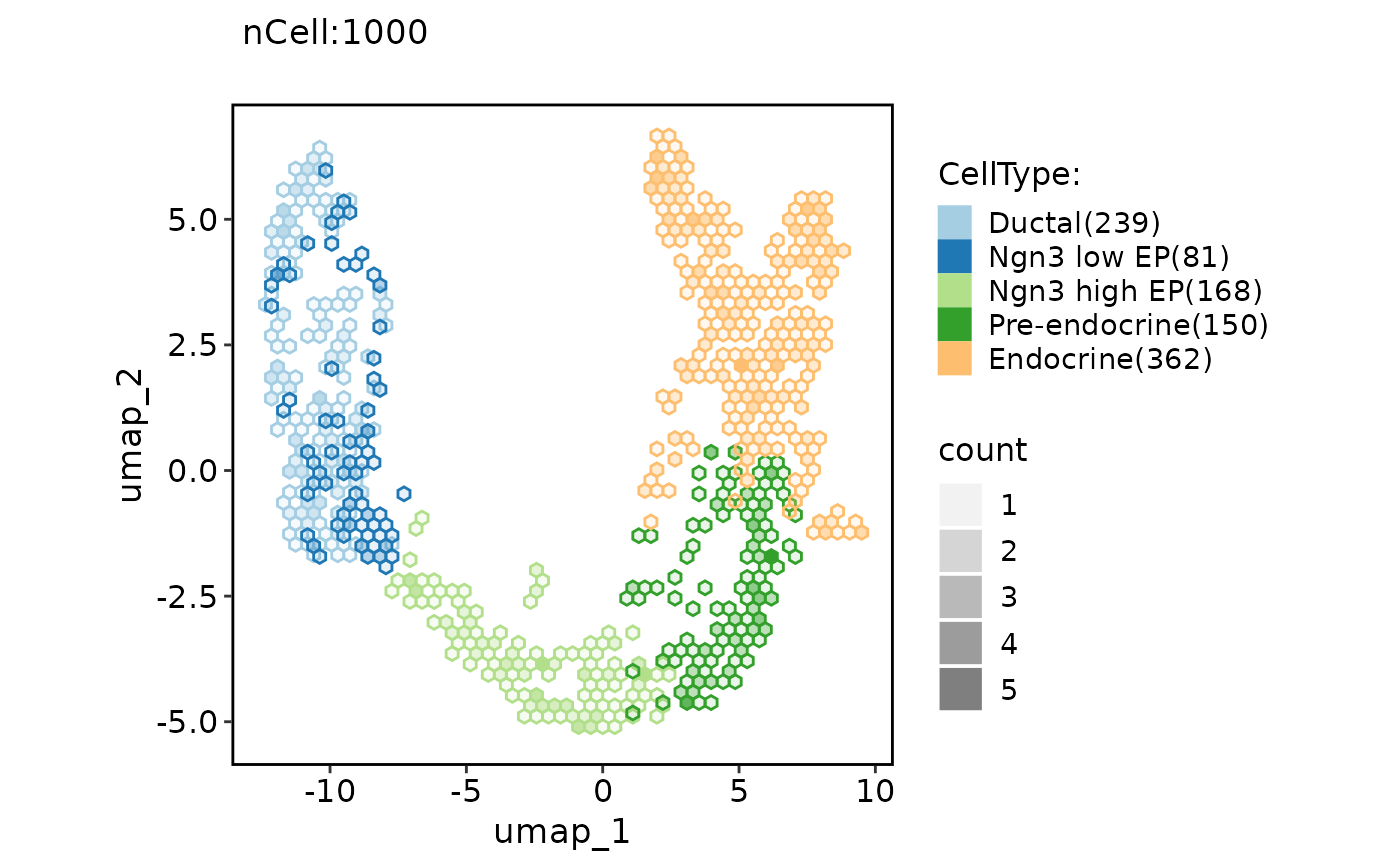
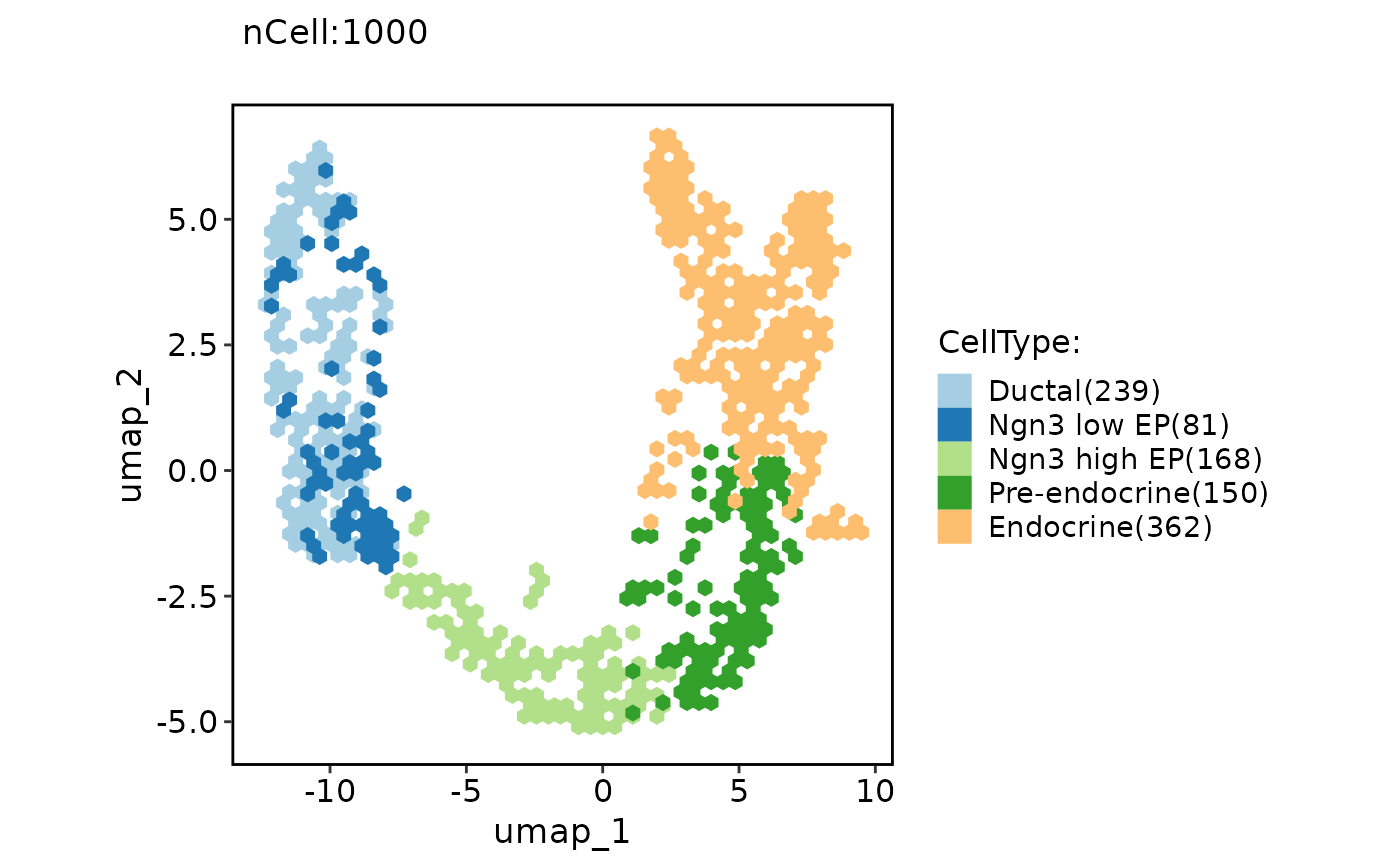
 # Chane the plot type from point to the hexagonal bin
ClassDimPlot(pancreas_sub, group.by = "CellType", reduction = "UMAP", hex = TRUE)
#> Warning: Removed 5 rows containing missing values (`geom_hex()`).
# Chane the plot type from point to the hexagonal bin
ClassDimPlot(pancreas_sub, group.by = "CellType", reduction = "UMAP", hex = TRUE)
#> Warning: Removed 5 rows containing missing values (`geom_hex()`).
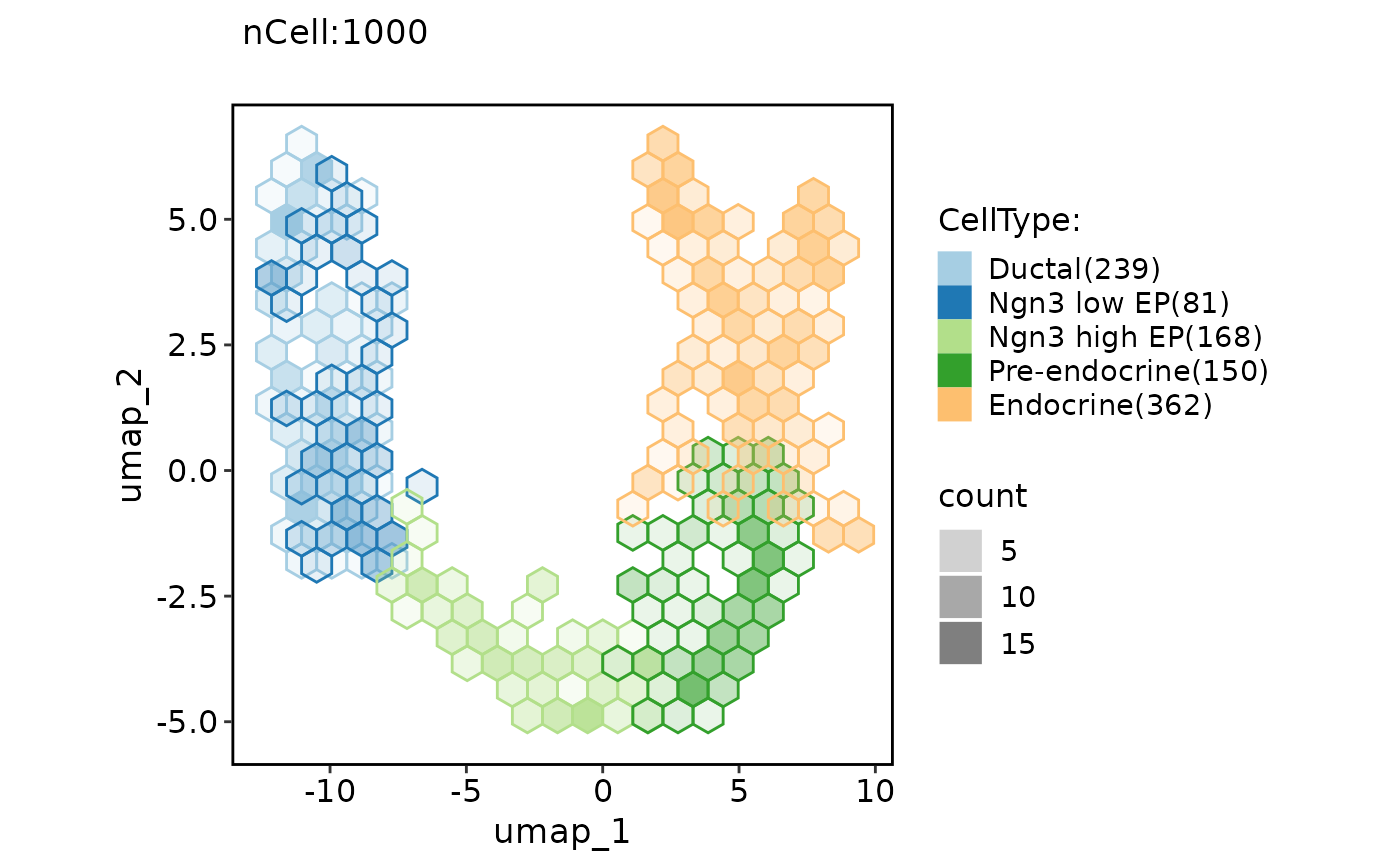
 ClassDimPlot(pancreas_sub, group.by = "CellType", reduction = "UMAP", hex = TRUE, hex.bins = 20)
#> Warning: Removed 4 rows containing missing values (`geom_hex()`).
ClassDimPlot(pancreas_sub, group.by = "CellType", reduction = "UMAP", hex = TRUE, hex.bins = 20)
#> Warning: Removed 4 rows containing missing values (`geom_hex()`).
 ClassDimPlot(pancreas_sub, group.by = "CellType", reduction = "UMAP", hex = TRUE, hex.count = FALSE)
#> Warning: Removed 5 rows containing missing values (`geom_hex()`).
ClassDimPlot(pancreas_sub, group.by = "CellType", reduction = "UMAP", hex = TRUE, hex.count = FALSE)
#> Warning: Removed 5 rows containing missing values (`geom_hex()`).
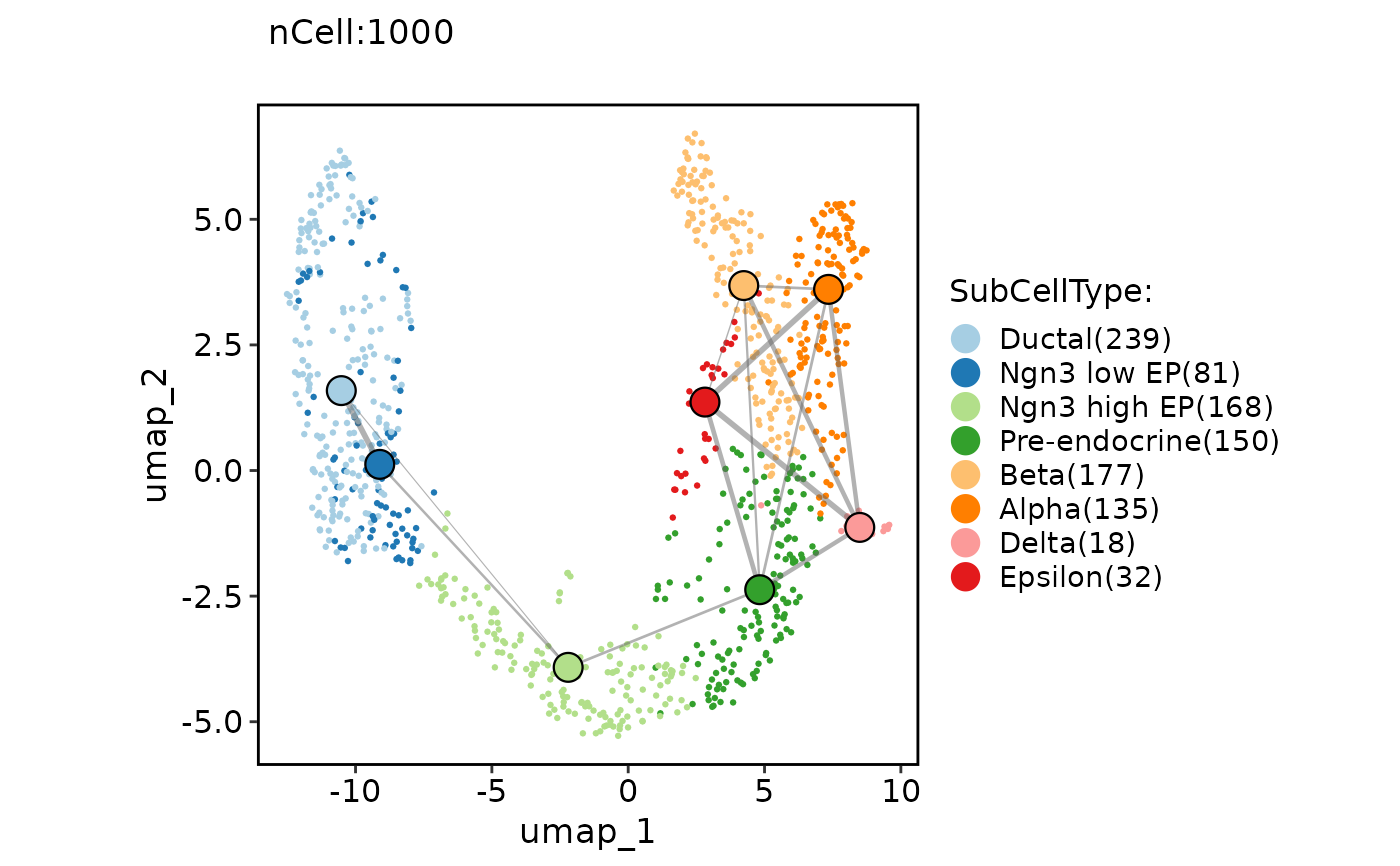
 # Show cell-cell graph on the plot
pancreas_sub <- Standard_SCP(pancreas_sub)
#> [2023-02-15 23:40:48] Start Standard_SCP
#> [2023-02-15 23:40:48] Checking srtList... ...
#> Data 1/1 of the srtList is raw_counts. Perform NormalizeData(LogNormalize) on the data ...
#> Perform FindVariableFeatures on the data 1/1 of the srtList...
#> Use the separate HVF from srtList...
#> Number of available HVF: 2000
#> [2023-02-15 23:40:49] Finished checking.
#> [2023-02-15 23:40:49] Perform ScaleData on the data...
#> [2023-02-15 23:40:49] Perform linear dimension reduction (pca) on the data...
#> [2023-02-15 23:40:50] Perform FindClusters (louvain) on the data...
#> [2023-02-15 23:40:50] Reorder clusters...
#> [2023-02-15 23:40:51] Perform nonlinear dimension reduction (umap) on the data...
#> Non-linear dimensionality reduction(umap) using Reduction(Standardpca, dims_range:1-50) as input
#> Non-linear dimensionality reduction(umap) using Reduction(Standardpca, dims_range:1-50) as input
#> [2023-02-15 23:41:00] Standard_SCP done
#> Elapsed time: 12.06 secs
ClassDimPlot(pancreas_sub, group.by = "CellType", reduction = "UMAP", graph = "Standardpca_SNN")
# Show cell-cell graph on the plot
pancreas_sub <- Standard_SCP(pancreas_sub)
#> [2023-02-15 23:40:48] Start Standard_SCP
#> [2023-02-15 23:40:48] Checking srtList... ...
#> Data 1/1 of the srtList is raw_counts. Perform NormalizeData(LogNormalize) on the data ...
#> Perform FindVariableFeatures on the data 1/1 of the srtList...
#> Use the separate HVF from srtList...
#> Number of available HVF: 2000
#> [2023-02-15 23:40:49] Finished checking.
#> [2023-02-15 23:40:49] Perform ScaleData on the data...
#> [2023-02-15 23:40:49] Perform linear dimension reduction (pca) on the data...
#> [2023-02-15 23:40:50] Perform FindClusters (louvain) on the data...
#> [2023-02-15 23:40:50] Reorder clusters...
#> [2023-02-15 23:40:51] Perform nonlinear dimension reduction (umap) on the data...
#> Non-linear dimensionality reduction(umap) using Reduction(Standardpca, dims_range:1-50) as input
#> Non-linear dimensionality reduction(umap) using Reduction(Standardpca, dims_range:1-50) as input
#> [2023-02-15 23:41:00] Standard_SCP done
#> Elapsed time: 12.06 secs
ClassDimPlot(pancreas_sub, group.by = "CellType", reduction = "UMAP", graph = "Standardpca_SNN")
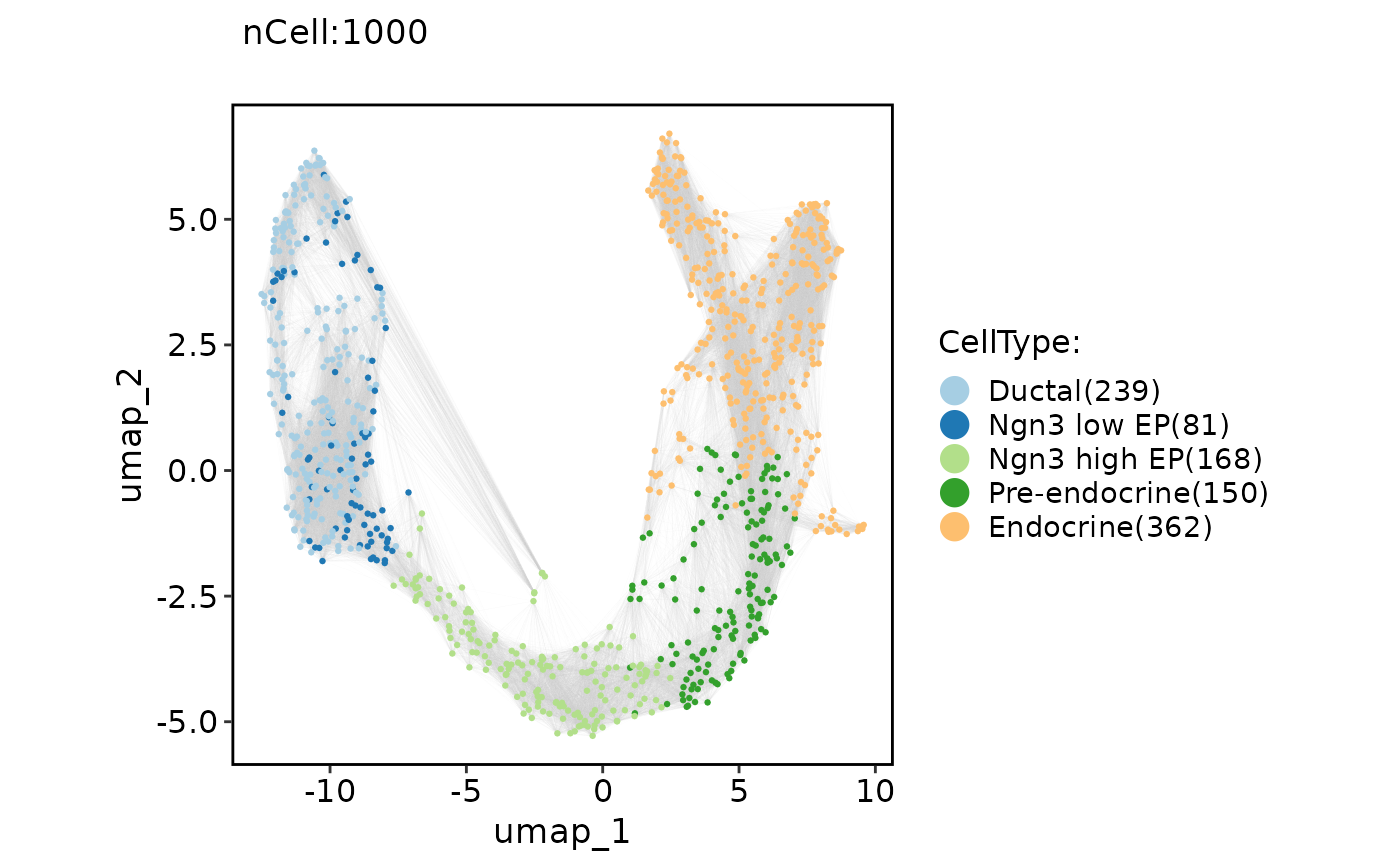
 ClassDimPlot(pancreas_sub, group.by = "CellType", reduction = "UMAP", graph = "Standardpca_SNN", edge_color = "grey80")
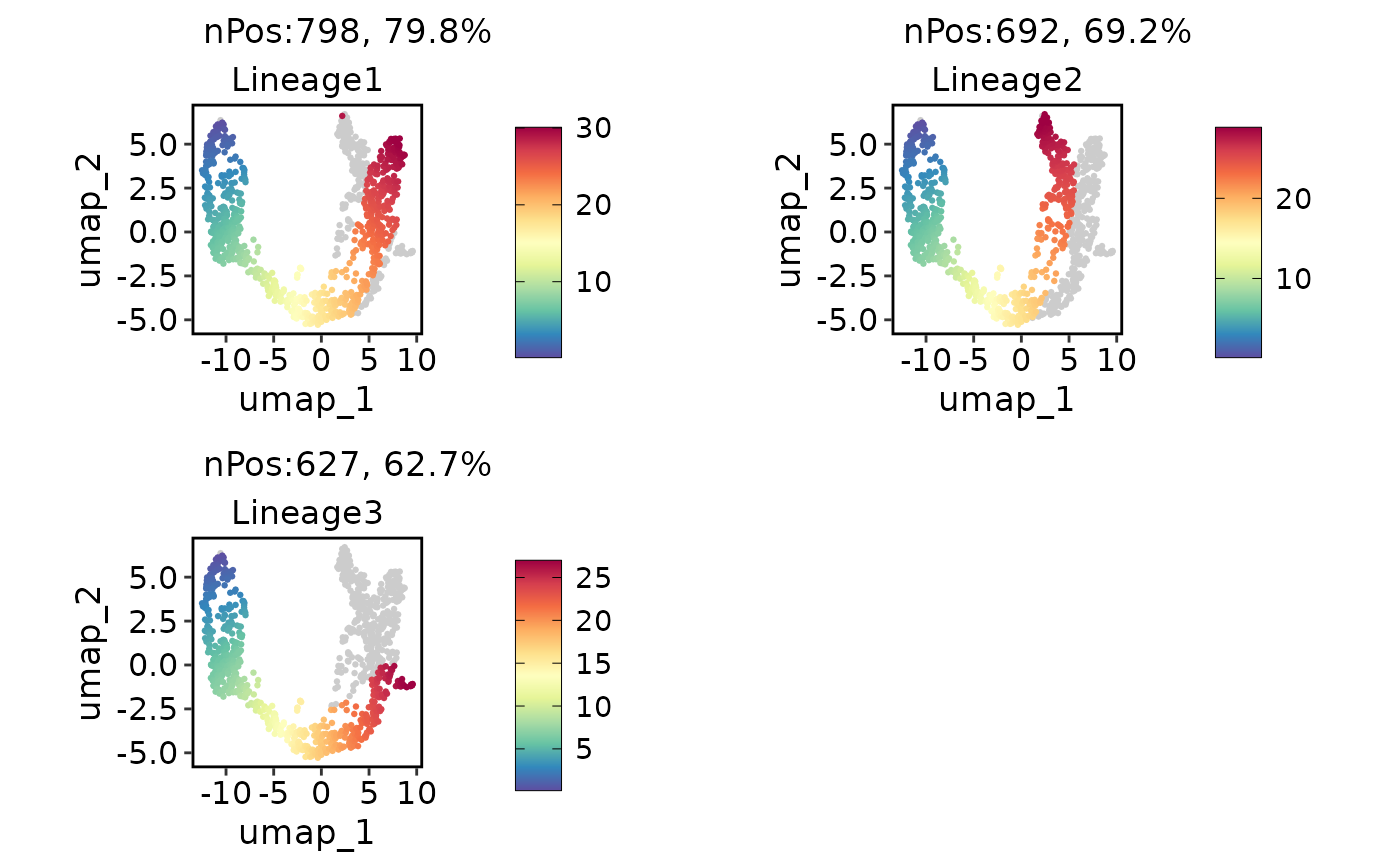
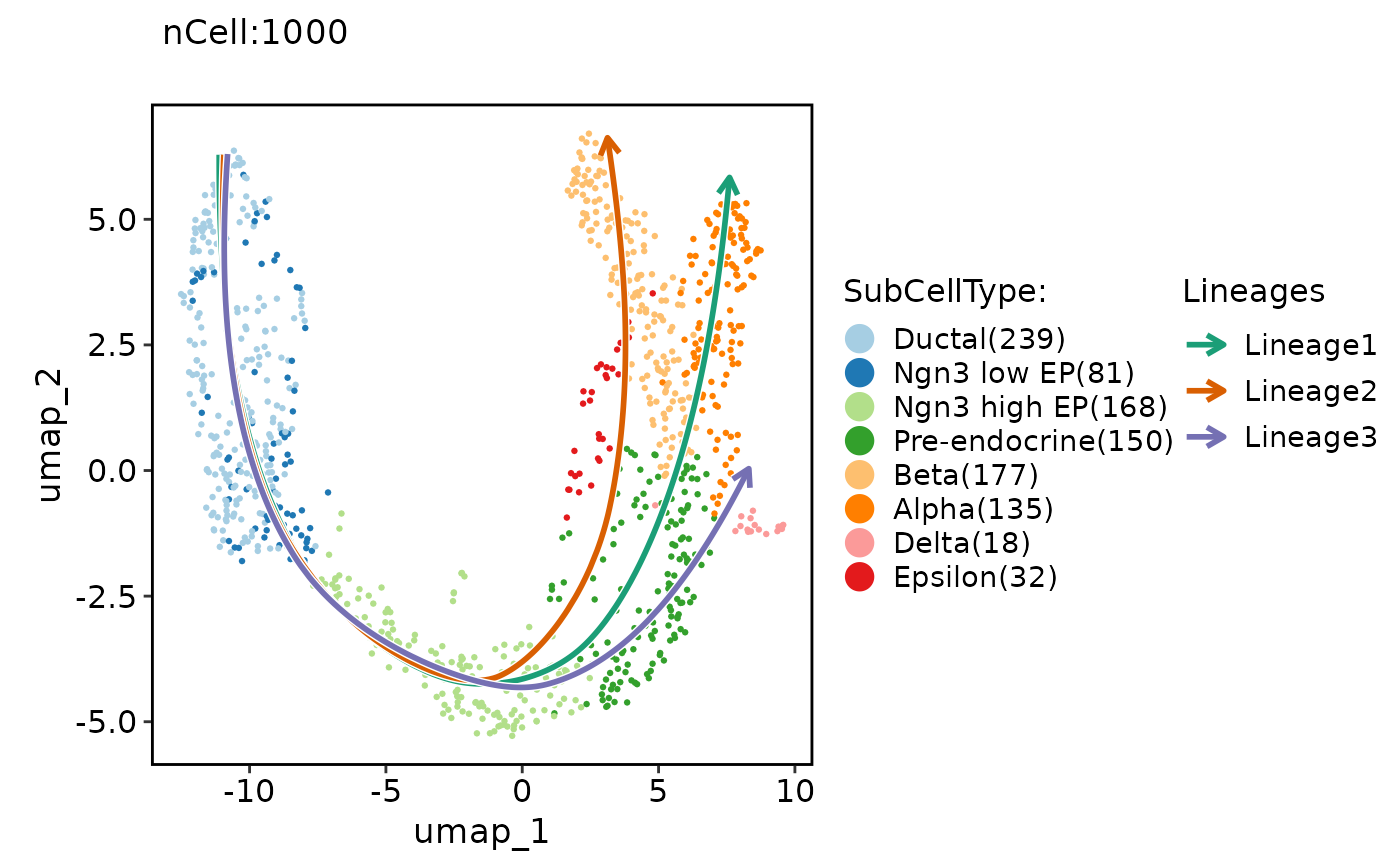
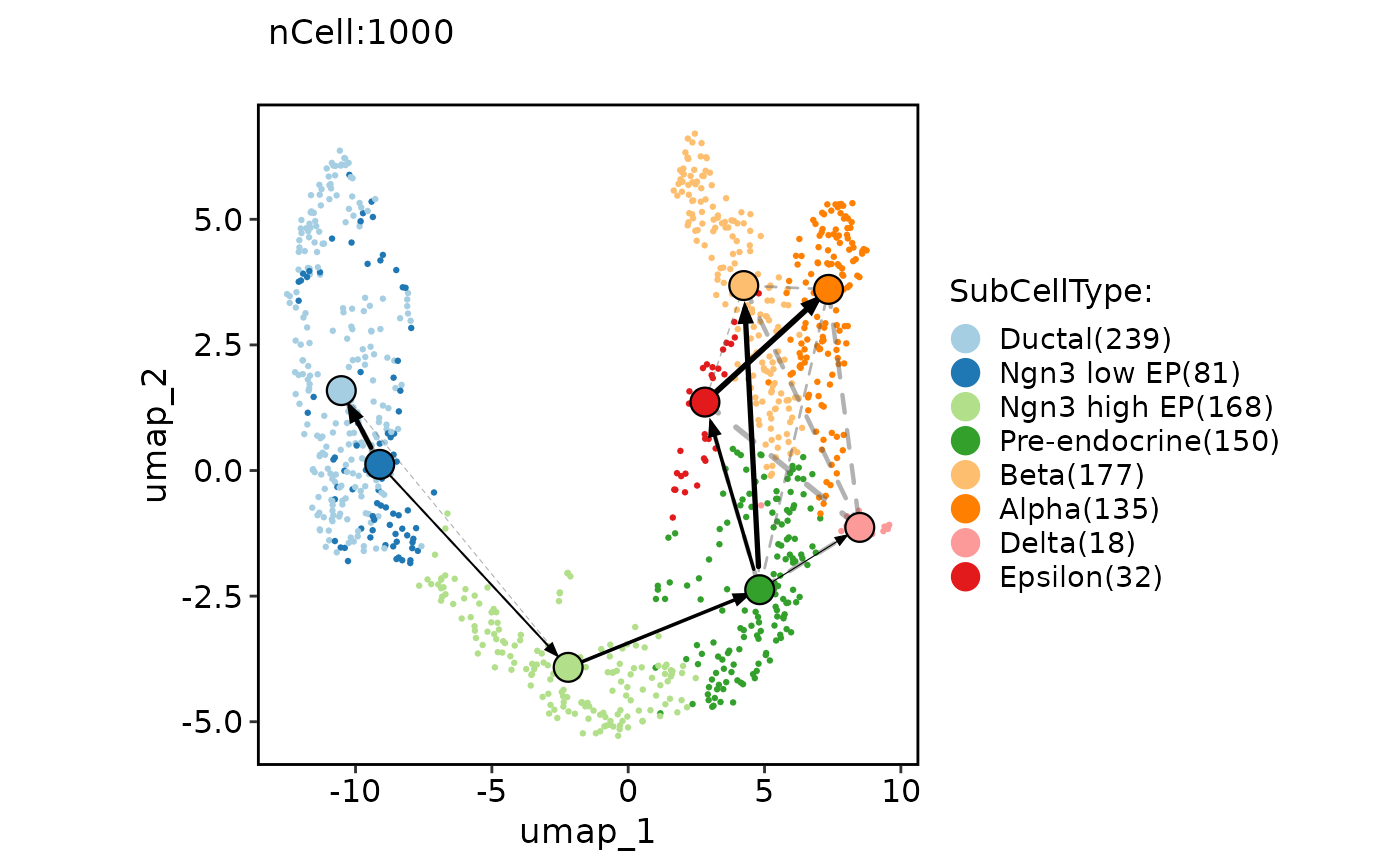
 # Show the lineage on the plot based on the pseudotime
pancreas_sub <- RunSlingshot(pancreas_sub, group.by = "SubCellType", reduction = "UMAP", show_plot = FALSE)
ExpDimPlot(pancreas_sub, features = paste0("Lineage", 1:3), reduction = "UMAP")
# Show the lineage on the plot based on the pseudotime
pancreas_sub <- RunSlingshot(pancreas_sub, group.by = "SubCellType", reduction = "UMAP", show_plot = FALSE)
ExpDimPlot(pancreas_sub, features = paste0("Lineage", 1:3), reduction = "UMAP")
 ClassDimPlot(pancreas_sub, group.by = "SubCellType", reduction = "UMAP", lineages = paste0("Lineage", 1:3))
#> Warning: Removed 8 rows containing missing values (`geom_path()`).
#> Warning: Removed 8 rows containing missing values (`geom_path()`).
ClassDimPlot(pancreas_sub, group.by = "SubCellType", reduction = "UMAP", lineages = paste0("Lineage", 1:3))
#> Warning: Removed 8 rows containing missing values (`geom_path()`).
#> Warning: Removed 8 rows containing missing values (`geom_path()`).
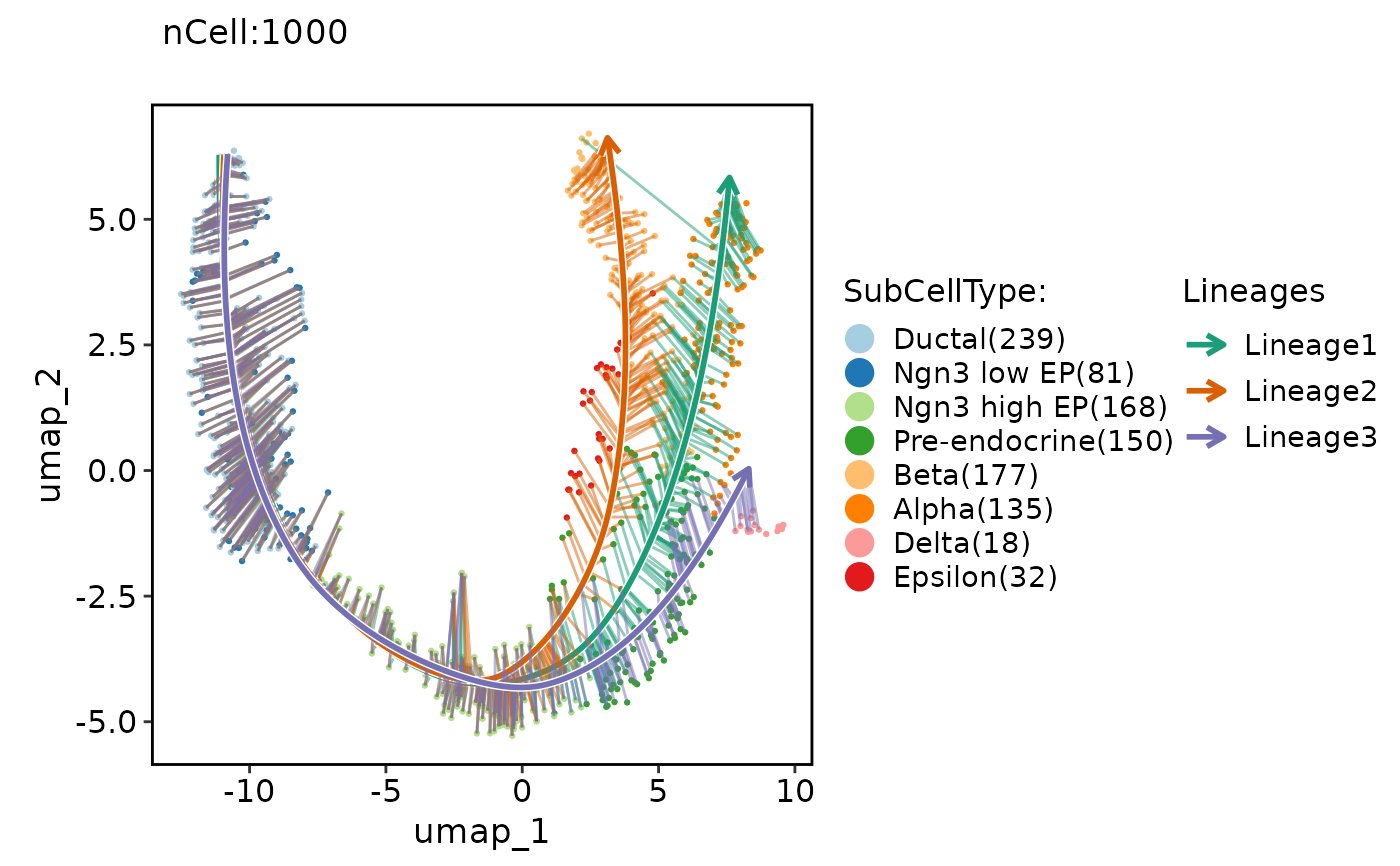
 ClassDimPlot(pancreas_sub, group.by = "SubCellType", reduction = "UMAP", lineages = paste0("Lineage", 1:3), lineages_whiskers = TRUE)
#> Warning: Removed 8 rows containing missing values (`geom_segment()`).
#> Warning: Removed 8 rows containing missing values (`geom_path()`).
#> Warning: Removed 8 rows containing missing values (`geom_path()`).
ClassDimPlot(pancreas_sub, group.by = "SubCellType", reduction = "UMAP", lineages = paste0("Lineage", 1:3), lineages_whiskers = TRUE)
#> Warning: Removed 8 rows containing missing values (`geom_segment()`).
#> Warning: Removed 8 rows containing missing values (`geom_path()`).
#> Warning: Removed 8 rows containing missing values (`geom_path()`).
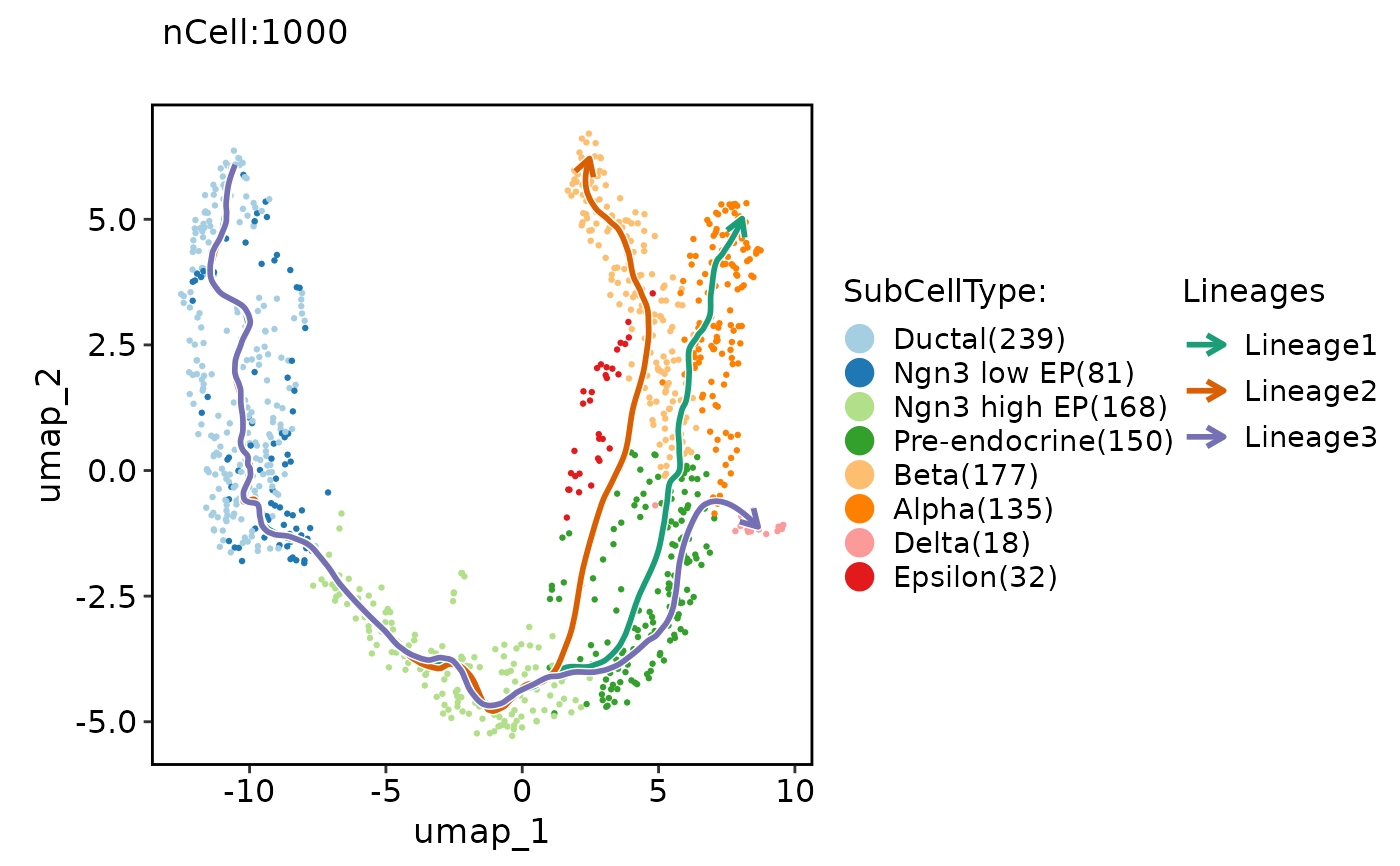
 ClassDimPlot(pancreas_sub, group.by = "SubCellType", reduction = "UMAP", lineages = paste0("Lineage", 1:3), lineages_span = 0.1)
 # Show PAGA result on the plot
pancreas_sub <- RunPAGA(srt = pancreas_sub, group_by = "SubCellType", linear_reduction = "PCA", nonlinear_reduction = "UMAP", return_seurat = TRUE)
#> Warning: SCP_env python environment does not exist. Create it with the PrepareEnv function...
#> + '/usr/share/miniconda/bin/conda' 'create' '--yes' '--name' 'SCP_env' 'python=3.8' '--quiet' '-c' 'conda-forge'
#> Try to install numpy==1.21.6,numba==0.55.2,scikit-learn==1.1.2,pandas==1.3.5,python-igraph==0.10.2,matplotlib==3.6.3,scipy,versioned-hdf5,leidenalg,scanpy,scvelo,palantir ...
#> ====================== SCP conda environment ======================
#> conda: /usr/share/miniconda/bin/conda
#> environment: /usr/share/miniconda/envs/SCP_env
#> ======================== SCP python config ========================
#> python: /usr/share/miniconda/envs/SCP_env/bin/python3.8
#> libpython: /usr/share/miniconda/envs/SCP_env/lib/libpython3.8.so
#> pythonhome: /usr/share/miniconda/envs/SCP_env:/usr/share/miniconda/envs/SCP_env
#> version: 3.8.16 | packaged by conda-forge | (default, Feb 1 2023, 16:01:55) [GCC 11.3.0]
#> numpy: /usr/share/miniconda/envs/SCP_env/lib/python3.8/site-packages/numpy
#> numpy_version: 1.21.6
#>
#> NOTE: Python version was forced by use_python function
#> ===================================================================
#> 'misc' slot is not converted.
#> 'tools' slot is not converted.
#> Warning: 'uns: neighbors' will not be converted. You may need to convert it manually.
ClassDimPlot(pancreas_sub, group.by = "SubCellType", reduction = "UMAP", paga = pancreas_sub@misc$paga)
# Show PAGA result on the plot
pancreas_sub <- RunPAGA(srt = pancreas_sub, group_by = "SubCellType", linear_reduction = "PCA", nonlinear_reduction = "UMAP", return_seurat = TRUE)
#> Warning: SCP_env python environment does not exist. Create it with the PrepareEnv function...
#> + '/usr/share/miniconda/bin/conda' 'create' '--yes' '--name' 'SCP_env' 'python=3.8' '--quiet' '-c' 'conda-forge'
#> Try to install numpy==1.21.6,numba==0.55.2,scikit-learn==1.1.2,pandas==1.3.5,python-igraph==0.10.2,matplotlib==3.6.3,scipy,versioned-hdf5,leidenalg,scanpy,scvelo,palantir ...
#> ====================== SCP conda environment ======================
#> conda: /usr/share/miniconda/bin/conda
#> environment: /usr/share/miniconda/envs/SCP_env
#> ======================== SCP python config ========================
#> python: /usr/share/miniconda/envs/SCP_env/bin/python3.8
#> libpython: /usr/share/miniconda/envs/SCP_env/lib/libpython3.8.so
#> pythonhome: /usr/share/miniconda/envs/SCP_env:/usr/share/miniconda/envs/SCP_env
#> version: 3.8.16 | packaged by conda-forge | (default, Feb 1 2023, 16:01:55) [GCC 11.3.0]
#> numpy: /usr/share/miniconda/envs/SCP_env/lib/python3.8/site-packages/numpy
#> numpy_version: 1.21.6
#>
#> NOTE: Python version was forced by use_python function
#> ===================================================================
#> 'misc' slot is not converted.
#> 'tools' slot is not converted.
#> Warning: 'uns: neighbors' will not be converted. You may need to convert it manually.
ClassDimPlot(pancreas_sub, group.by = "SubCellType", reduction = "UMAP", paga = pancreas_sub@misc$paga)
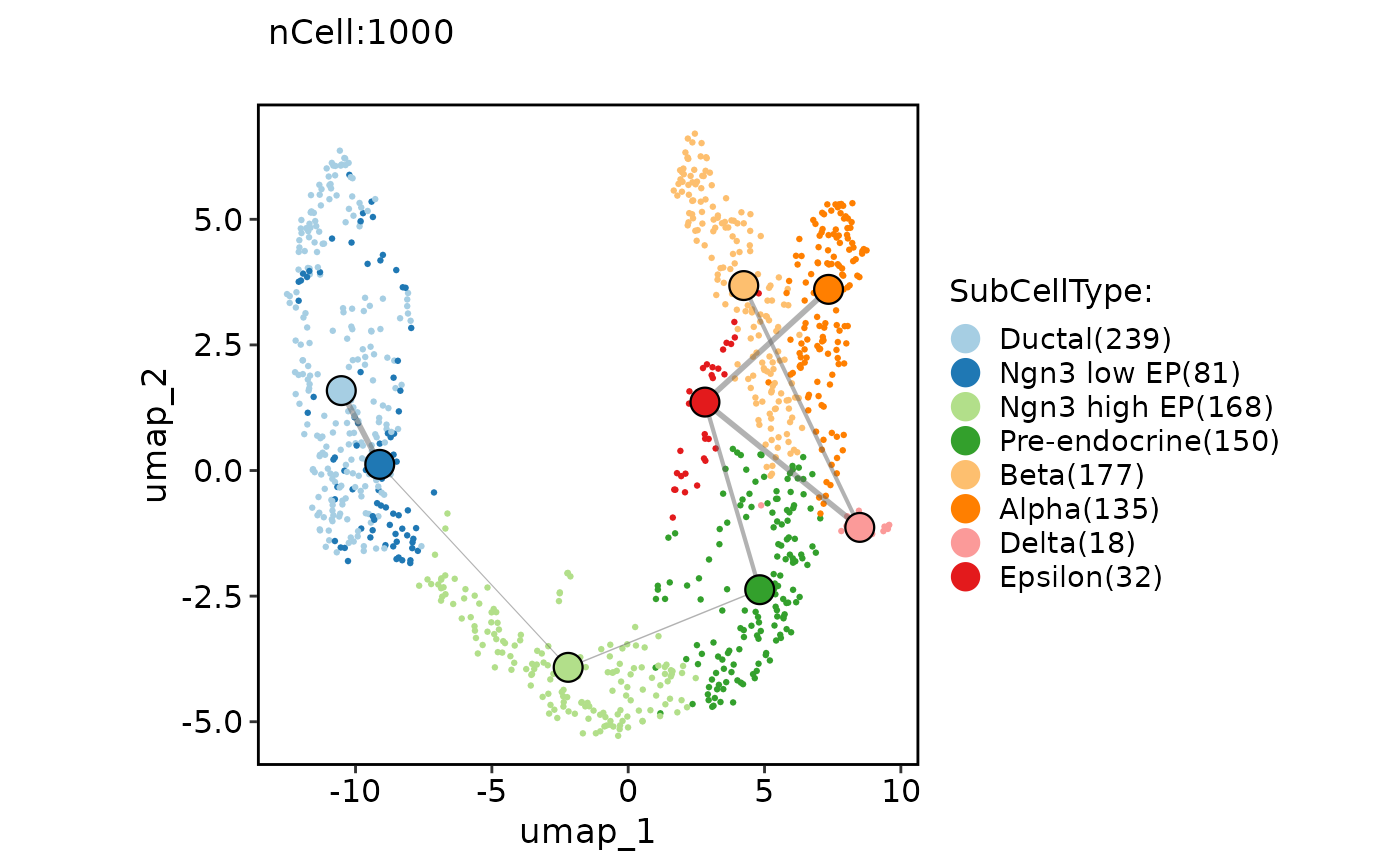
 ClassDimPlot(pancreas_sub, group.by = "SubCellType", reduction = "UMAP", paga = pancreas_sub@misc$paga, paga_type = "connectivities_tree")
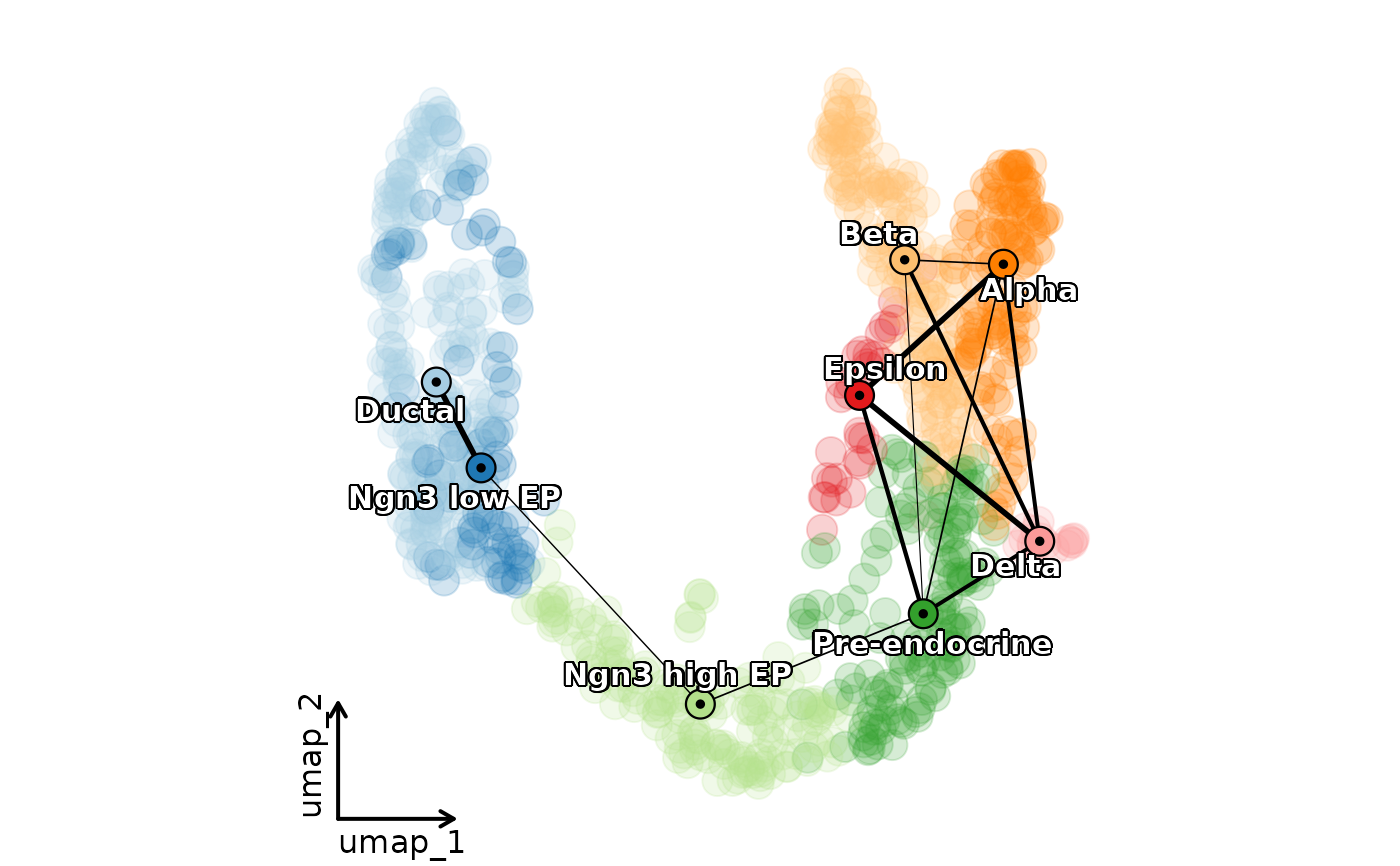
 ClassDimPlot(pancreas_sub,
group.by = "SubCellType", reduction = "UMAP", pt.size = 5, pt.alpha = 0.2,
label = TRUE, label_repel = TRUE, label_insitu = TRUE, label_segment_color = "transparent",
paga = pancreas_sub@misc$paga, paga_edge_threshold = 0.1, paga_edge_color = "black", paga_edge_alpha = 1,
show_stat = FALSE, legend.position = "none", theme_use = "theme_blank"
)
ClassDimPlot(pancreas_sub,
group.by = "SubCellType", reduction = "UMAP", pt.size = 5, pt.alpha = 0.2,
label = TRUE, label_repel = TRUE, label_insitu = TRUE, label_segment_color = "transparent",
paga = pancreas_sub@misc$paga, paga_edge_threshold = 0.1, paga_edge_color = "black", paga_edge_alpha = 1,
show_stat = FALSE, legend.position = "none", theme_use = "theme_blank"
)
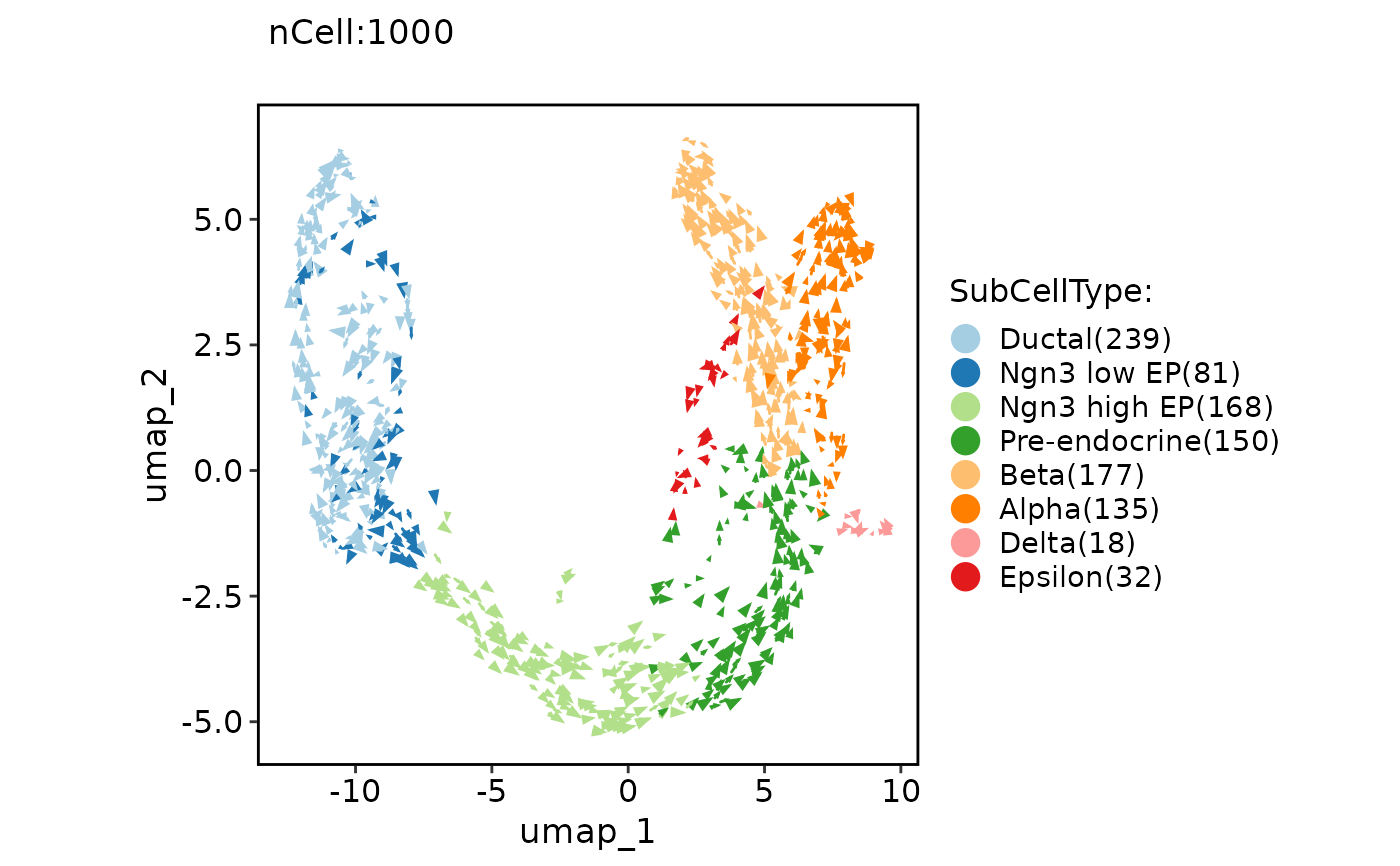
 # Show RNA velocity result on the plot
pancreas_sub <- RunSCVELO(srt = pancreas_sub, group_by = "SubCellType", linear_reduction = "PCA", nonlinear_reduction = "UMAP", mode = "stochastic", return_seurat = TRUE)
#> 'misc' slot is not converted.
#> 'tools' slot is not converted.
#> Warning: Keys should be one or more alphanumeric characters followed by an underscore, setting key from variance_stochastic_ to variancestochastic_
#> Warning: Keys should be one or more alphanumeric characters followed by an underscore, setting key from variance_velocity_ to variancevelocity_
#> Warning: 'uns: neighbors' will not be converted. You may need to convert it manually.
ClassDimPlot(pancreas_sub, group.by = "SubCellType", reduction = "UMAP", paga = pancreas_sub@misc$paga, paga_show_transition = TRUE)
# Show RNA velocity result on the plot
pancreas_sub <- RunSCVELO(srt = pancreas_sub, group_by = "SubCellType", linear_reduction = "PCA", nonlinear_reduction = "UMAP", mode = "stochastic", return_seurat = TRUE)
#> 'misc' slot is not converted.
#> 'tools' slot is not converted.
#> Warning: Keys should be one or more alphanumeric characters followed by an underscore, setting key from variance_stochastic_ to variancestochastic_
#> Warning: Keys should be one or more alphanumeric characters followed by an underscore, setting key from variance_velocity_ to variancevelocity_
#> Warning: 'uns: neighbors' will not be converted. You may need to convert it manually.
ClassDimPlot(pancreas_sub, group.by = "SubCellType", reduction = "UMAP", paga = pancreas_sub@misc$paga, paga_show_transition = TRUE)
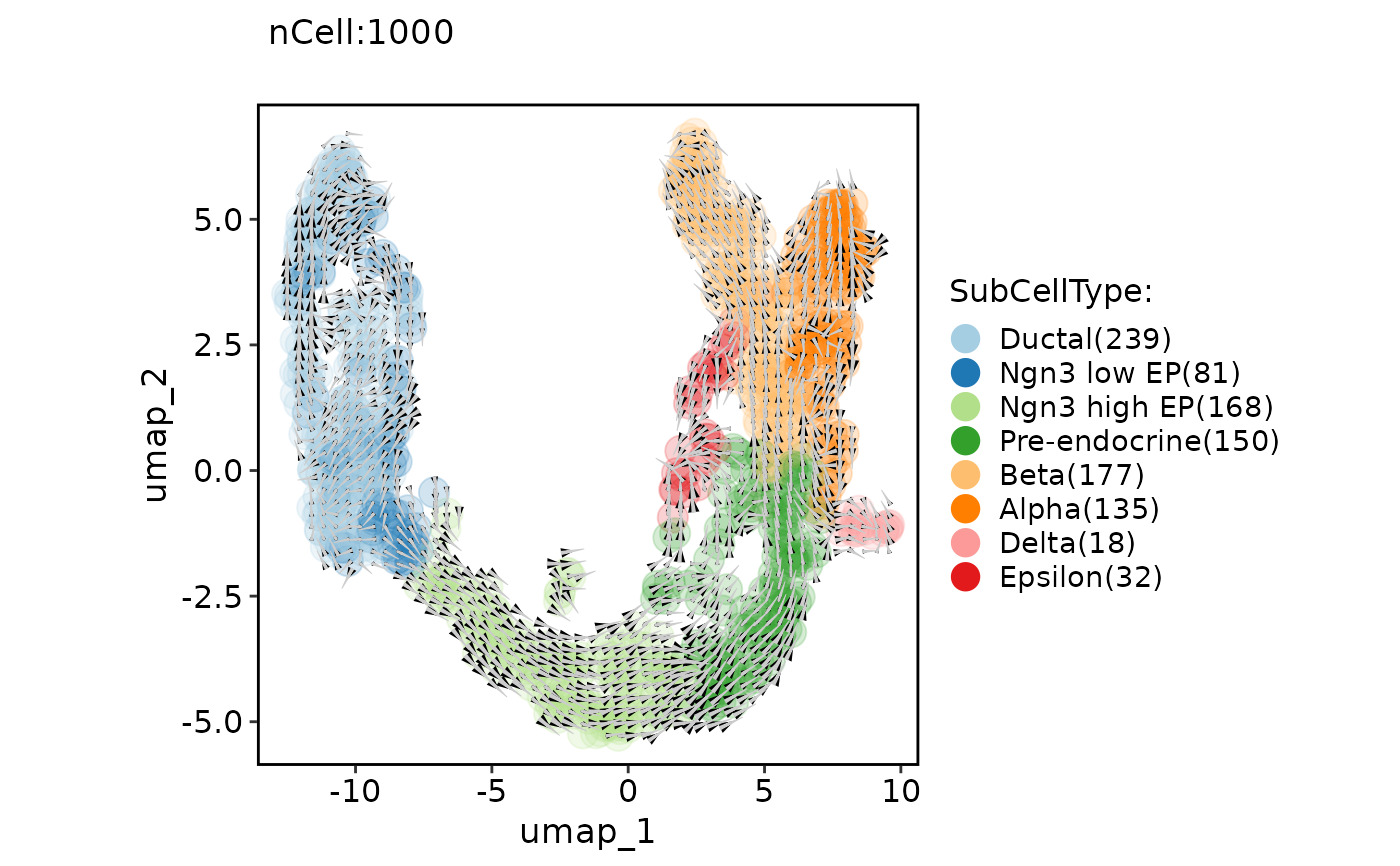
 ClassDimPlot(pancreas_sub, group.by = "SubCellType", reduction = "UMAP", pt.size = NA, velocity = "stochastic")
#> Warning: Removed 1000 rows containing missing values (`geom_point()`).
#> Warning: Removed 1000 rows containing missing values (`geom_point()`).
#> Warning: Removed 4 rows containing missing values (`geom_segment()`).
ClassDimPlot(pancreas_sub, group.by = "SubCellType", reduction = "UMAP", pt.size = NA, velocity = "stochastic")
#> Warning: Removed 1000 rows containing missing values (`geom_point()`).
#> Warning: Removed 1000 rows containing missing values (`geom_point()`).
#> Warning: Removed 4 rows containing missing values (`geom_segment()`).
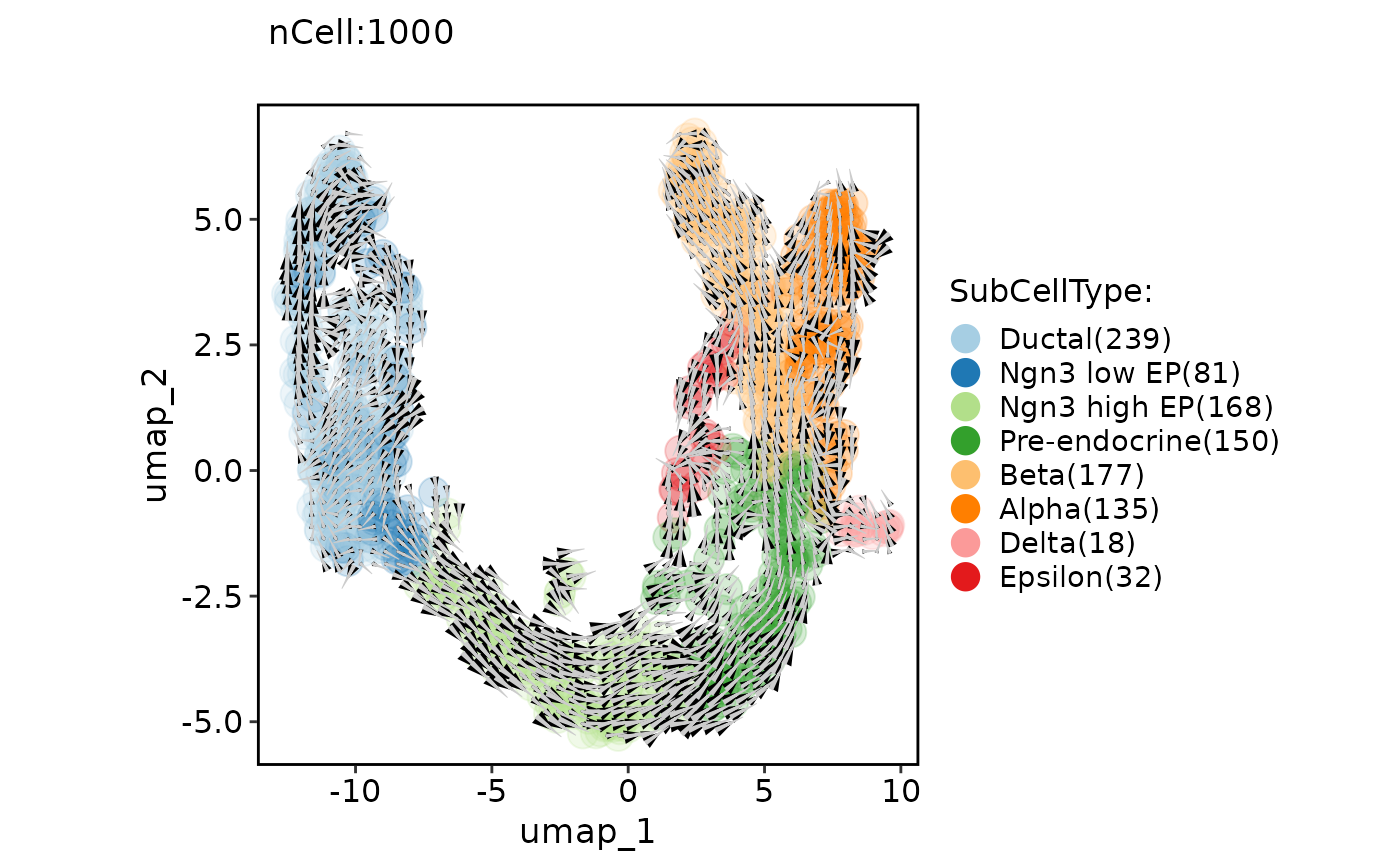
 ClassDimPlot(pancreas_sub, group.by = "SubCellType", reduction = "UMAP", pt.size = 5, pt.alpha = 0.2, velocity = "stochastic", velocity_plot_type = "grid")
#> Warning: Removed 14 rows containing missing values (`geom_segment()`).
#> Warning: Removed 14 rows containing missing values (`geom_segment()`).
ClassDimPlot(pancreas_sub, group.by = "SubCellType", reduction = "UMAP", pt.size = 5, pt.alpha = 0.2, velocity = "stochastic", velocity_plot_type = "grid")
#> Warning: Removed 14 rows containing missing values (`geom_segment()`).
#> Warning: Removed 14 rows containing missing values (`geom_segment()`).
 ClassDimPlot(pancreas_sub, group.by = "SubCellType", reduction = "UMAP", pt.size = 5, pt.alpha = 0.2, velocity = "stochastic", velocity_plot_type = "grid", velocity_scale = 1.5)
#> Warning: Removed 14 rows containing missing values (`geom_segment()`).
#> Warning: Removed 14 rows containing missing values (`geom_segment()`).
ClassDimPlot(pancreas_sub, group.by = "SubCellType", reduction = "UMAP", pt.size = 5, pt.alpha = 0.2, velocity = "stochastic", velocity_plot_type = "grid", velocity_scale = 1.5)
#> Warning: Removed 14 rows containing missing values (`geom_segment()`).
#> Warning: Removed 14 rows containing missing values (`geom_segment()`).
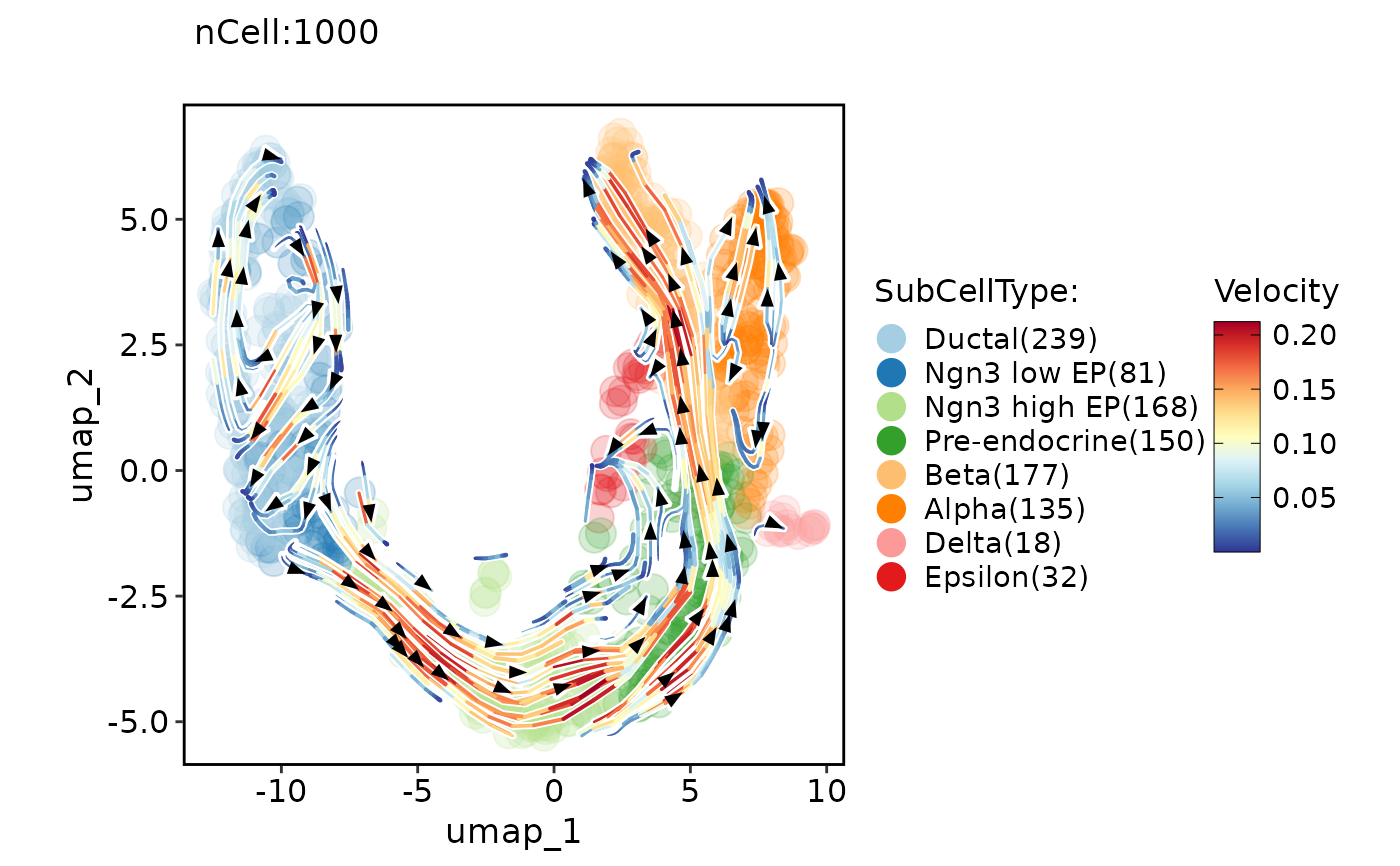
 ClassDimPlot(pancreas_sub, group.by = "SubCellType", reduction = "UMAP", pt.size = 5, pt.alpha = 0.2, velocity = "stochastic", velocity_plot_type = "stream")
#> Warning: The dot-dot notation (`..step..`) was deprecated in ggplot2 3.4.0.
#> ℹ Please use `after_stat(step)` instead.
#> ℹ The deprecated feature was likely used in the SCP package.
#> Please report the issue to the authors.
ClassDimPlot(pancreas_sub, group.by = "SubCellType", reduction = "UMAP", pt.size = 5, pt.alpha = 0.2, velocity = "stochastic", velocity_plot_type = "stream")
#> Warning: The dot-dot notation (`..step..`) was deprecated in ggplot2 3.4.0.
#> ℹ Please use `after_stat(step)` instead.
#> ℹ The deprecated feature was likely used in the SCP package.
#> Please report the issue to the authors.
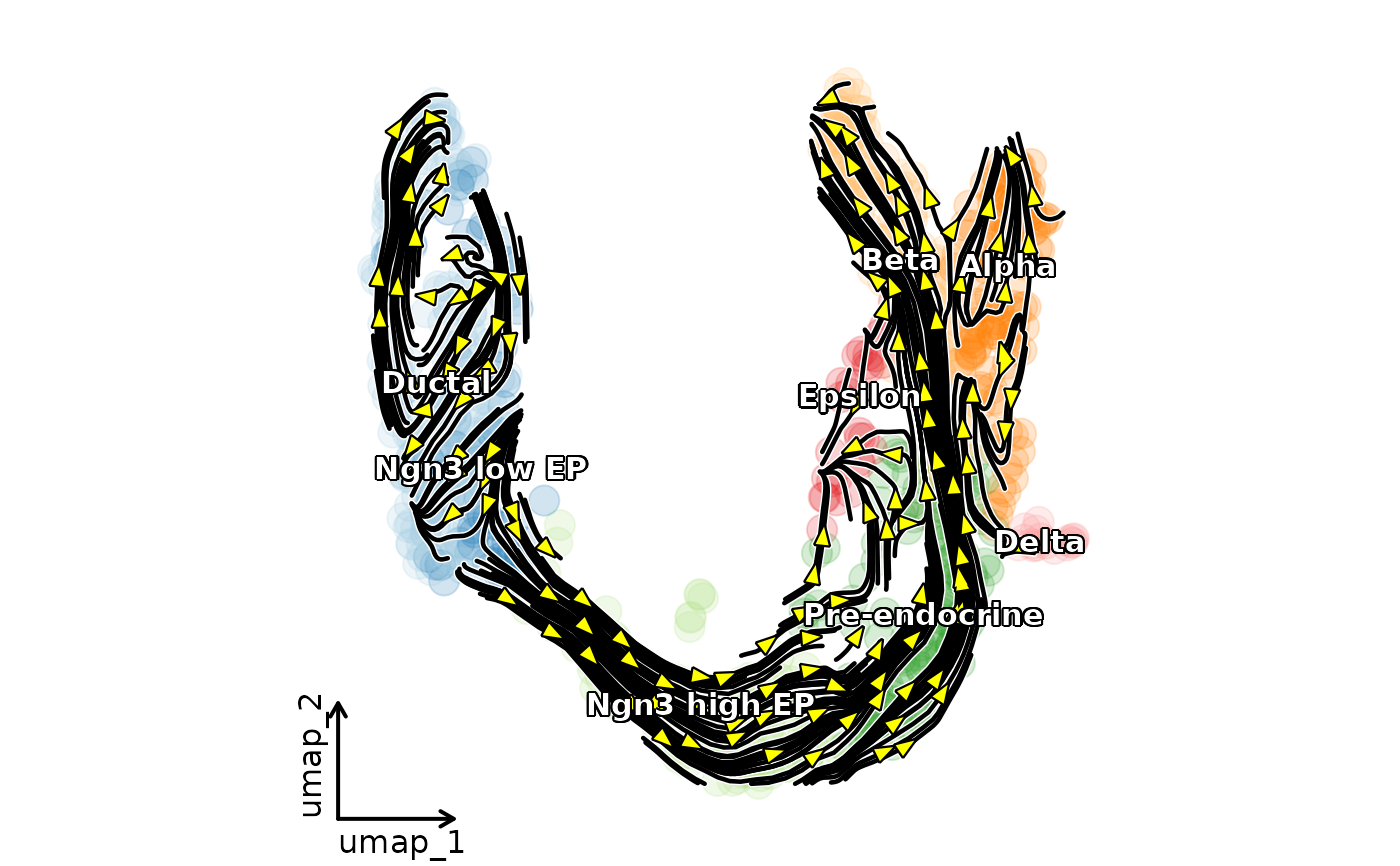
 ClassDimPlot(pancreas_sub,
group.by = "SubCellType", reduction = "UMAP", pt.size = 5, pt.alpha = 0.2,
label = TRUE, label_insitu = TRUE,
velocity = "stochastic", velocity_plot_type = "stream", velocity_arrow_color = "yellow",
velocity_density = 2, velocity_smooth = 1, streamline_n = 20, streamline_color = "black",
show_stat = FALSE, legend.position = "none", theme_use = "theme_blank"
)
ClassDimPlot(pancreas_sub,
group.by = "SubCellType", reduction = "UMAP", pt.size = 5, pt.alpha = 0.2,
label = TRUE, label_insitu = TRUE,
velocity = "stochastic", velocity_plot_type = "stream", velocity_arrow_color = "yellow",
velocity_density = 2, velocity_smooth = 1, streamline_n = 20, streamline_color = "black",
show_stat = FALSE, legend.position = "none", theme_use = "theme_blank"
)